 Global| Mar 06 2006
Commodity Prices Strong - Except Natural Gas
by:Tom Moeller
|in:Economy in Brief
Summary
Crude oil prices have been quite strong of late. On Friday, spot WTI crude stood at $63.68 per barrel. Still down slightly from the early year highs near $68, prices have recovered from below $58.00 just two weeks ago. That strength [...]
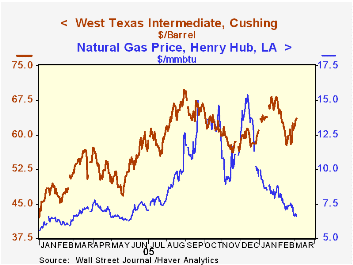
Crude oil prices have been quite strong of late. On Friday, spot WTI crude stood at $63.68 per barrel. Still down slightly from the early year highs near $68, prices have recovered from below $58.00 just two weeks ago.
That strength fueled inflationary concerns generally and lifted Friday's gold price to $565.00 per ounce, up $26 from two weeks earlier. Since 1980 there has been a 66% correlation between the level of gold prices and the y/y change in consumer prices.
Also during the last two weeks, industrial metal prices were strong due to indications of a resilient factory sector. The JoC-ECRI Industrial Metals Prices Index rose 4.1% (14.8% y/y) since mid-February due to a 7.8% (21.3% y/y) rise in aluminum ingot prices and a 2.7% (52.1% y/y) gain in high grade copper. In addition, prices of stainless steel scrap are up 18.8% (-4.3% y/y) since year end '05.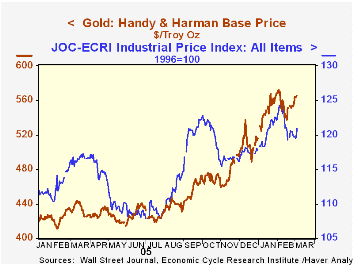
The laggard on the pricing scene has been natural gas. As of Friday, The Henry Hub price for gas fell to $6.59/mmbtu (-1.6% y/y), nearly half the high of $12.72 averaged during December. January's record warm temperatures did drop to a more seasonable cold during February, but warm temperatures during the last week hint that the end of the heating season is near.
Retail gasoline prices at $2.25 (16.6% y/y) per gallon also are off the earlier lows but very recently have fallen 10 cents from late January.
The Economic Outlook for the United States, a speech by Federal Reserve Vice Chairman Roger W. Ferguson, Jr. on Friday, is available here.
| Weekly Prices | 02/28/06 | 12/27/05 | Y/Y | 2005 | 2004 | 2003 |
|---|---|---|---|---|---|---|
| Light Sweet Crude Oil, WTI (per bbl.) | $61.42 | $58.16 | 18.8% | $58.16 | $41.78 | $32.78 |
| Gold: Handy & Harmon (per Troy Oz.) | $556.00 | $568.75 | 28.3% | $507.40 | $443.40 | $416.25 |
by Tom Moeller March 6, 2006
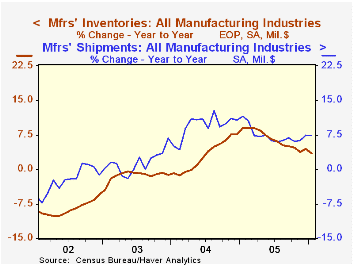
Factory inventories grew 0.5% in January following an upwardly revised 0.6% increase during December. Though the rate of inventory accumulation slowed sharply during the last year, the 3.5% y/y growth contrasts with outright decumulation from 2001 to 2003 and probably suggests only cautious management rather than a pessimistic outlook.
A 1.1% (2.4% y/y) increase in primary metals inventories was accompanied by a 1.1% (2.1% y/y) rise in fabricated metals, but both paled next to a 1.7% (6.9% y/y) gain in electrical equipment and a 1.1% (5.8% y/y) increase in machinery.
Total factory orders dropped 4.5% from December and the advance report of a 10.2% plunge in durable goods orders was mitigated only slightly to -9.9%. The drop reflected a huge 68.3% (+61.4% y/y) decline in nondefense aircraft and a 20.9% (+57.4% y/y) drop in defense aircraft & parts. Factory orders less the transportation sector altogether rose 1.6% (8.3% y/y).
Factory shipments increased 0.3% but less transportation shipments rose 1.4% (7.5% y/y), a gain inflated only slightly by higher petroleum prices.
Unfilled orders fell 0.7% after the 2.6% surge which was powered by higher aircraft orders. Less the transportation sector, backlogs rose 0.4% (10.5% y/y) for the second consecutive month.
| Factory Survey (NAICS) | Jan | Dec | Y/Y | 2005 | 2004 | 2003 |
|---|---|---|---|---|---|---|
| Inventories | 0.5% | 0.6% | 3.5% | 4.4% | 7.7% | -1.1% |
| New Orders | -4.5% | 1.6% | 6.9% | 8.5% | 9.3% | 3.5% |
| Shipments | 0.3% | 2.4% | 7.2% | 7.4% | 9.5% | 1.5% |
| Unfilled Orders | -0.7% | 2.6% | 16.1% | 16.5% | 8.4% | 8.0% |
by Louise Curley March 6, 2006
Thailand released data on its fourth quarter Gross Domestic Product today. GDP in the fourth quarter was 4.71% above the fourth quarter of 2004. For the year as a whole, the increase in GDP was 4.48%, compared with a rise of 6.16% last year. Slower growth in private consumption, gross fixed capital formation and exports of goods and services outweighed the positive impacts of lower imports, higher inventory accumulation and a sharp increase in government consumption expenditures.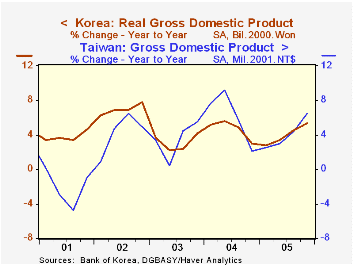
With the release of Thailand's data, 2005 data for all the countries, except Pakistan and Vietnam, in the Haver Data Base EMERGEPR are now available. (Data for Pakistan and Vietnam are reported only on an annual basis. The latest data are for 2004.)
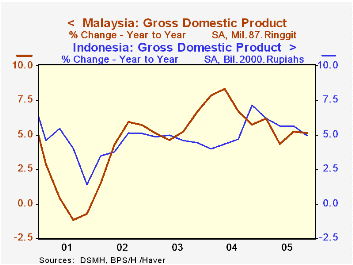
Growth in most countries was below that of 2004. The exceptions were China, India and Indonesia. Growth in China and India showed little trend during the year, but was maintained at high levels--above 7% for India and above 9% for China. While growth in Indonesia, averaged an increase in 2005, the trend throughout the year was downward.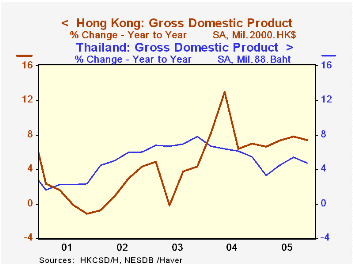
The quarterly trend of year over year growth varied. In Malaysia, as in Indonesia, the trend was downward as shown in the first chart. In Singapore, South Korea, the Philippines and in Taiwan, there was a definite upward trend during the year. The second chart shows the year to year percent change in GDP for South Korea and Taiwan.Growth in Hong Kong and Thailand, like India and China showed little trend during the year. The year to year percent changes in GDP for these countries are shown in the third chart.
| Gross Domestic Product Y/Y % Change |
Q4 05 % | Q3 05 % | Q2 05 % | Q1 05 % | 2005 % | 2004 % |
|---|---|---|---|---|---|---|
| China | 9.9 | 9.8 | 10.1 | 9.9 | 9.9 | 9.5 |
| India | 7.71 | 7.93 | 8.22 | 7.09 | 7.74 | 7.51 |
| Hong Kong | 7.38 | 7.82 | 7.35 | 6.57 | 7.28 | 8.60 |
| Indonesia | 4.92 | 5.67 | 5.64 | 6.21 | 5.60 | 5.06 |
| Malaysia | 5.12 | 5.25 | 4.35 | 6.20 | 5.23 | 7.14 |
| Philippines | 6.20 | 4.49 | 5.15 | 4.49 | 5.09 | 6.01 |
| Singapore | 8.45 | 7.60 | 5.70 | 3.57 | 6.35 | 8.72 |
| South Korea | 5.39 | 4.55 | 3.39 | 2.75 | 4.03 | 4.66 |
| Taiwan | 6.51 | 4.40 | 3.02 | 2.59 | 4.12 | 6.13 |
| Thailand | 4.71 | 5.40 | 4.54 | 3.26 | 4.48 | 6.16 |

Tom Moeller
AuthorMore in Author Profile »Prior to joining Haver Analytics in 2000, Mr. Moeller worked as the Economist at Chancellor Capital Management from 1985 to 1999. There, he developed comprehensive economic forecasts and interpreted economic data for equity and fixed income portfolio managers. Also at Chancellor, Mr. Moeller worked as an equity analyst and was responsible for researching and rating companies in the economically sensitive automobile and housing industries for investment in Chancellor’s equity portfolio. Prior to joining Chancellor, Mr. Moeller was an Economist at Citibank from 1979 to 1984. He also analyzed pricing behavior in the metals industry for the Council on Wage and Price Stability in Washington, D.C. In 1999, Mr. Moeller received the award for most accurate forecast from the Forecasters' Club of New York. From 1990 to 1992 he was President of the New York Association for Business Economists. Mr. Moeller earned an M.B.A. in Finance from Fordham University, where he graduated in 1987. He holds a Bachelor of Arts in Economics from George Washington University.
More Economy in Brief


