 Global| Mar 30 2009
Commodity Prices Meander
by:Tom Moeller
|in:Economy in Brief
Summary
At best, the recent movement in commodity prices suggests that recessionary forces are diminishing. Prices for oil, copper and grains have stabilized after sharp declines in last year's second half. The price of gold has moved to the [...]
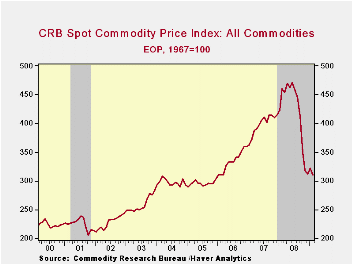
At best, the recent movement in commodity prices suggests that recessionary forces are diminishing. Prices for oil, copper and grains have stabilized after sharp declines in last year's second half. The price of gold has moved to the high end of the last year's range. Continued recovery in prices is dependent, of course, on whether worldwide economic recovery develops. So far, the move in commodity prices alone is not convincing.
Crude oil prices have shown some bottoming with the price of WTI crude rising to $50 per barrel from the $40 low. But the case for a turnaround is not strong. The recession in the U.S. industrial sector and fewer car-miles driven have lowered the demand for all petroleum products by 3.2% y/y after the 3.5% decline last year. And a pending upturn is not yet signaled by various leading indicators. Inventory decumulation rates are picking up steam and consumer sentiment remains depressed. Abroad, recessionary forces are gaining steam. Industrial output in Germany and France fell 11-12% through the end of last year and production in Japan was off by roughly one quarter.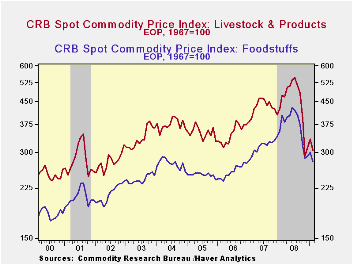
The worldwide recession also has taken its hold on industrial metals prices as factory sector output has fallen sharply. Prices for aluminum, stainless steel scrap and high grade copper are 50% lower than a year ago and the latest bottoming in copper prices is tentative, at best.An upturn in metals prices awaits recovery in global manufacturing sector activity.
Food prices have been mixed, with an upward trend. Wheat and corn prices recently recovered modestly after earlier sharp declines. Conversely, beef prices which showed signs of stability, have moved lower. The upward trend to prices overall derives from several global forces, notably economic development (upward income mobility) in the worlds' economies and government mandated bio-fuel standards.
Finally, gold prices have strengthened recently and they have reached new highs of near $1,000 per ounce. Platinum and silver prices have strengthen as well from the lows of last fall but they still are down by 25% to 40% year to year.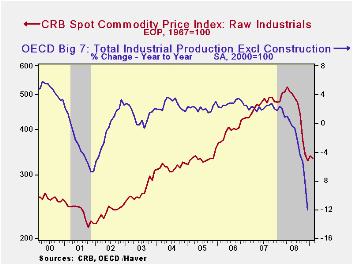
Overall, commodity prices have shown just a small effect on consumer price inflation. At most they account for one-third of the price of a particular product. It's as an indicator of demand that they are valuable. They are quite sensitive to changes in the supply-demand equation. As of yet they may be signaling that the U.S. recession was passed its worst stage. Factory sector output fell 5.4%, 9.2% then 17.4% (AR) through the first three quarters of 2008. OECD output in the big 7 nations similarly fell at a 3.5%, 6.8% then 21.8% rate in 2008.
The commodity price series in the table below can be found in Haver's WEEKLY database. The monetary and inflation figures cited above are available in USECON.
A Framework for Analyzing Bank Lending is today's speech by Fed Governor Elizabeth A. Duke and it can be found here.
The Risk of Deflation from the Federal Reserve Bank of San Francisco is available here.
| Commodity Prices | Latest Week | Y/Y | February | January | March '08 | 2008 | 2007 | 2006 |
|---|---|---|---|---|---|---|---|---|
| Industrial Metals | ||||||||
| Aluminum ($/lb.) | 0.64 | -50.4% | 0.99 | 0.63 | 1.34 | 1.18 | 1.18 | 1.18 |
| Stainless Steel Scrap ($/Ton) | 1,188 | -59.9% | 1,201 | -- | 2,893 | 2,121 | 2,786 | 2,918 |
| High Grade Copper ($/ton) | 1.80 | -51.4% | 1.50 | 1.51 | 3.77 | 1.31 | 3.06 | 3.04 |
| Foods | ||||||||
| Milk (Cents/lb.) | 85 | -34.6% | 85 | 84 | 132 | 86 | 172 | 145 |
| Beef Carcass (Index Value) | 126.6 | -4.3% | 127.0 | 136.2 | 135.3 | 134.6 | 139.3 | 134.1 |
| Corn, No. 2 Yellow ($/bushel) | 3.70 | -27.5% | 3.44 | 3.59 | 5.18 | 3.76 | 4.14 | 3.46 |
| Wheat, Soft Red ($/bushel) | 4.35 | -50.0% | 3.42 | 3.49 | 9.43 | 4.78 | 8.64 | 4.77 |
| Light Sweet Crude Oil, WTI ($/bbl.) | 49.46 | -53.3% | 39.05 | 41.72 | 105.78 | 100.16 | 72.25 | 66.12 |
| Gold, Handy & Harmon ($/oz.) | 923.75 | -0.3% | 941.63 | 856.38 | 972.06 | 869.75 | 810.5 | 628.7 |

Tom Moeller
AuthorMore in Author Profile »Prior to joining Haver Analytics in 2000, Mr. Moeller worked as the Economist at Chancellor Capital Management from 1985 to 1999. There, he developed comprehensive economic forecasts and interpreted economic data for equity and fixed income portfolio managers. Also at Chancellor, Mr. Moeller worked as an equity analyst and was responsible for researching and rating companies in the economically sensitive automobile and housing industries for investment in Chancellor’s equity portfolio. Prior to joining Chancellor, Mr. Moeller was an Economist at Citibank from 1979 to 1984. He also analyzed pricing behavior in the metals industry for the Council on Wage and Price Stability in Washington, D.C. In 1999, Mr. Moeller received the award for most accurate forecast from the Forecasters' Club of New York. From 1990 to 1992 he was President of the New York Association for Business Economists. Mr. Moeller earned an M.B.A. in Finance from Fordham University, where he graduated in 1987. He holds a Bachelor of Arts in Economics from George Washington University.
More Economy in Brief


