 Global| Jan 22 2007
Chicago Fed Nat'l Activity Index Positive
by:Tom Moeller
|in:Economy in Brief
Summary
For the first month since August, the National Activity Index (CFNAI) from the Federal Reserve Bank of Chicago turned modestly positive in December. The reading of 0.04 was the first in positive territory since a similar reading in [...]
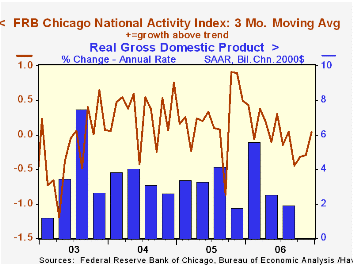
For the first month since August, the National Activity Index (CFNAI) from the Federal Reserve Bank of Chicago turned modestly positive in December. The reading of 0.04 was the first in positive territory since a similar reading in August.
The three-month moving average of the CFNAI, however, remained negative at -0.19 and for the whole year 2006 the index's level of zero was the lowest in three years.
A zero value of the CFNAI indicates that the economy is expanding at its historical trend rate of growth and during the last twenty years there has been a 68% correlation between the level of the CFNAI and q/q growth in real GDP.
Production contributed positively to the December index but the contribution from employment was negative.
The CFNAI is a weighted average of 85 indicators of economic activity. The indicators reflect activity in the following categories: production and income, the labor market, personal consumption and housing, manufacturing and trade sales, and inventories & orders.
The complete CFNAI report is available here.
Understanding Unemployment from the Federal Reserve Bank of Cleveland can be found here.
| Chicago Fed | December | November | December '05 | 2006 | 2005 | 2004 |
|---|---|---|---|---|---|---|
| CFNAI | 0.04 | -0.30 | 0.49 | 0.00 | 0.21 | 0.30 |
by Louise Curley January 22, 2007
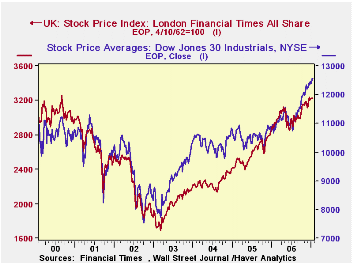
Stock markets at home and abroad were generally ebullient in the last half of 2006 and most continued to rise so far in 2007.In the United States and the United Kingdom the Dow Jones Average and the FTSE 500 surpassed record prices set back in 2000 as shown in the first chart. 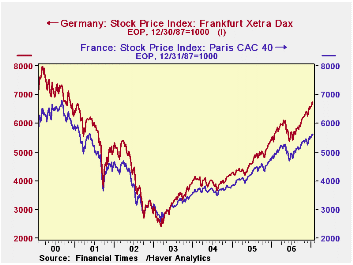 Stock markets in France and Germany have not surpassed 2000 levels, but they are getting close as shown in the second chart. The stock market in China has also surpassed its 2000 levels and in India where the stock market only began to surge in 2003, it has broken new records in 2007 as can be seem in the third chart. Data in the first three charts are end of the period weekly data.
There were however, two markets--Venezuela and Thailand--that experienced severe shocks as a result of political risks. 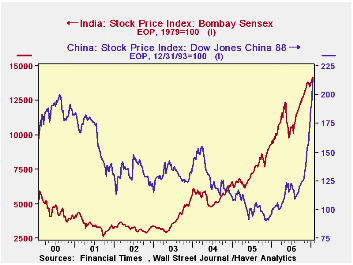 The imposition of capital controls in Thailand and of nationalization in Venezuela sent the stock markets in these countries reeling. The fourth chart shows the daily prices of stocks on the Venezuelan and Thai stock exchanges. The Thailand stock market was buffeted by the military coup of September 19th and more severely by the imposition of capital controls on December 19th.
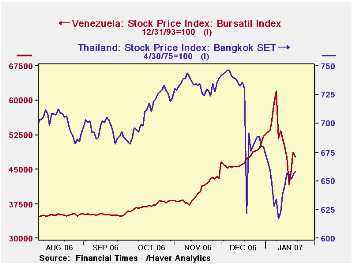 The controls were intended to restrain the rise of the baht which had appreciated from the greatly increased capital inflows. At that time the Set Index fell 15% in one day. The Bank of Thailand since rescinded the controls and the market recovered but is still well below levels reached before the controls were imposed. The effect of capital inflows on the exchange rate in those countries whose currencies are allowed to float remains a serious problem for many emerging markets.
It was the prospect of nationalization that hit the Venezuelan stock market. As in the case of Thailand, the market has since recovered, but remains below earlier levels. The re election of Chavez and the election of populist leaders in other Latin American countries have increased the possibility of further political risks.
| Stock Price Indexes | Jan 19 2007 | Dec 29 2006 | Jun 30 2006 | Jan 19/Dec 29 % | Dec 29/Jun 30 % |
|---|---|---|---|---|---|
| US Dow Jones Average | 12,565 | 12,463 | 11,150 | 0.82 | 11.77 |
| UK FTSE 4/10/62=100 | 3,229 | 3,222 | 2,968 | 0.21 | 8.59 |
| France CAC 40 12/31/87=100 | 5,614 | 5,542 | 4,966 | 1.32 | 11.56 |
| Germany Extra Dax 12/30/87=100 | 6,747 | 6,597 | 5,683 | 2.28 | 16.08 |
| China 88 12/31/93=100 | 215 | 188 | 122 | 13.98 | 54.16 |
| India Bombay Sensex Index 1979-100 | 14,183 | 13,787 | 10,609 | 2.87 | 29.95 |
| Thailand SET Index 4/30/75=100 | 658.17 | 679.84 | 678.13 | -3.19 | 0.25 |
| Venezuela Bursatil Index 12/31/93=100 | 47,722 | 52,234 | 30,747 | -8.64 | 69.88 |

Tom Moeller
AuthorMore in Author Profile »Prior to joining Haver Analytics in 2000, Mr. Moeller worked as the Economist at Chancellor Capital Management from 1985 to 1999. There, he developed comprehensive economic forecasts and interpreted economic data for equity and fixed income portfolio managers. Also at Chancellor, Mr. Moeller worked as an equity analyst and was responsible for researching and rating companies in the economically sensitive automobile and housing industries for investment in Chancellor’s equity portfolio. Prior to joining Chancellor, Mr. Moeller was an Economist at Citibank from 1979 to 1984. He also analyzed pricing behavior in the metals industry for the Council on Wage and Price Stability in Washington, D.C. In 1999, Mr. Moeller received the award for most accurate forecast from the Forecasters' Club of New York. From 1990 to 1992 he was President of the New York Association for Business Economists. Mr. Moeller earned an M.B.A. in Finance from Fordham University, where he graduated in 1987. He holds a Bachelor of Arts in Economics from George Washington University.
More Economy in Brief


