 Global| Jul 01 2003
Chain Store Sales Slump
by:Tom Moeller
|in:Economy in Brief
Summary
Chain store sales gave back last week virtually all of the prior week's gain according to the BTM-UBSW survey. The 0.5% w/w decline followed a 0.6% gain the week prior and continued the erratic sales performance of the last two [...]
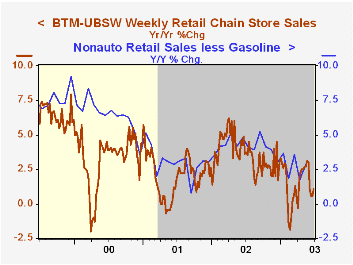
Chain store sales gave back last week virtually all of the prior week's gain according to the BTM-UBSW survey. The 0.5% w/w decline followed a 0.6% gain the week prior and continued the erratic sales performance of the last two months.
Sales in June rose 0.1% versus May. May sales rose 2.0% from April due only to a 2.1% increase in the first week of that month.
During the last five years there has been a 61% correlation between the year-to-year percent change in chain store sales and the change in nonauto retail sales less gasoline.
The BTM leading indicator of chain store sales fell 0.1% in the third week of June, the second decline in three weeks.
The BTM-UBSW retail chain-store sales index is constructed from the sales results reported by seven retailers: Dayton Hudson, Federated, Kmart, May, J.C. Penney, Sears and Wal-Mart.
| BTM-UBSW (SA, 1977=100) | 6/28/03 | 6/21/03 | Y/Y | 2002 | 2001 | 2000 |
|---|---|---|---|---|---|---|
| Total Weekly Retail Chain Store Sales | 417.3 | 419.4 | 1.1% | 3.6% | 2.1% | 3.4% |
by Tom Moeller July 1, 2003
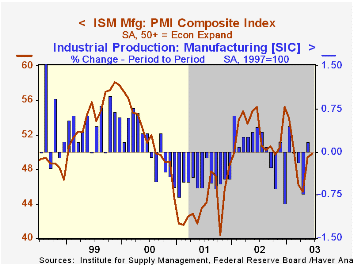
The ISM Composite Index of manufacturing sector activity rose to 49.8 last month from 49.4 in May. The gain was less than Consensus expectations for a rise to 51.0 and left the index below 50 for the fourth consecutive month.
During the last ten years there has been a 52% correlation between the level of the ISM index and the month to month change in factory sector industrial production.
New orders (52.2), production (52.9) and employment (46.2) each improved but the moderate gains were offset by lower inventories and vendor performance.
The index of export orders improved to 54.4, the highest level since February.
A separate index of inflation pressure recovered a bit of the sharp declines of the prior two months. Up five points, the index had fallen 18.5 points during April and May. This index is not seasonally adjusted.
| ISM Manufacturing Survey | June | May | Y/Y | 2002 | 2001 | 2000 |
|---|---|---|---|---|---|---|
| Composite Index | 49.8 | 49.4 | 55.2 | 52.4 | 44.0 | 51.7 |
| Prices Paid Index (NSA) | 56.5 | 51.5 | 66.5 | 57.6 | 42.9 | 64.8 |
by Tom Moeller July 1, 2003
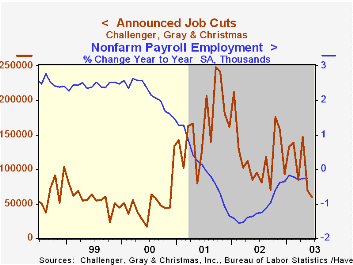
According to Challenger, Gray & Christmas, announced job cuts fell sharply for the second consecutive month in June. Layoff announcements fell 13.0% last month. That added to a 53.1% decline in May and dropped planned layoffs to the lowest level since November 2000.
The three month moving average of job cut announcements fell to its lowest level since last September.
Job cut announcements differ from layoffs in that many are achieved through attrition or just never occur.
During the last ten years there has been a 72% correlation between the y/y change in announced job cuts and the y/y percent change in initial claims for jobless insurance. Like claims, job cut announcements indicate little about new hiring activity.
Announcements of job cuts fell broadly although there were significant increases in several industries including apparel, automotive, chemical, food, media, pharmaceutical and retail.
| Challenger, Gray & Christmas | June | May | Y/Y | 2002 | 2001 |
|---|---|---|---|---|---|
| Announced Job Cuts | 59,715 | 68,623 | -37.0% | 1,431,052 | 1,956,876 |
by Tom Moeller July 1, 2003
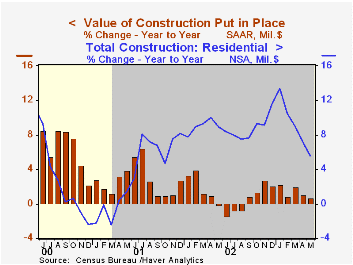
The value of construction put in place fell 0.5% (+0.7% y/y) in May versus Consensus expectations for a 0.3% gain.
The figures reflect benchmark revisions. In addition, the Census Department will cease publication of values real terms with the release of June data next month. Census also will cease publication of the data according to the old classification system and will report only using a new system based on end use.
Residential building expenditures fell for the fourth consecutive month (+6.4% y/y).
Office construction fell 3.7% (-16.4% y/y, down sharply for the third month in four. Manufacturing construction fell 2.1% (-25.9% y/y) and highways & streets dropped 1.9% (-5.3% y/y) for the fourth consecutive sharp decline.
| Construction Put-in-place | May | April | Y/Y | 2002 | 2001 | 2000 |
|---|---|---|---|---|---|---|
| Total | -0.5% | -0.3% | 0.7% | 1.1% | 2.7% | 8.3% |
| Residential | -0.3% | -0.5% | 5.6% | 8.8% | 3.7% | 6.6% |

Tom Moeller
AuthorMore in Author Profile »Prior to joining Haver Analytics in 2000, Mr. Moeller worked as the Economist at Chancellor Capital Management from 1985 to 1999. There, he developed comprehensive economic forecasts and interpreted economic data for equity and fixed income portfolio managers. Also at Chancellor, Mr. Moeller worked as an equity analyst and was responsible for researching and rating companies in the economically sensitive automobile and housing industries for investment in Chancellor’s equity portfolio. Prior to joining Chancellor, Mr. Moeller was an Economist at Citibank from 1979 to 1984. He also analyzed pricing behavior in the metals industry for the Council on Wage and Price Stability in Washington, D.C. In 1999, Mr. Moeller received the award for most accurate forecast from the Forecasters' Club of New York. From 1990 to 1992 he was President of the New York Association for Business Economists. Mr. Moeller earned an M.B.A. in Finance from Fordham University, where he graduated in 1987. He holds a Bachelor of Arts in Economics from George Washington University.


