 Global| Mar 31 2010
ADP Report: Private Sector JobLoss Disappoints Expectations
by:Tom Moeller
|in:Economy in Brief
Summary
The rate of job loss has been slowing for a year, but a turn to positive territory isn't yet at hand. The latest report from the payroll processor ADP, in their National Employment Report, indicated that February private nonfarm [...]
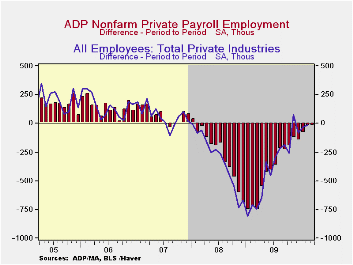 The rate of job loss has been slowing for a year, but a turn
to positive territory isn't yet at hand. The latest report from the
payroll processor ADP, in their National Employment Report, indicated
that February private nonfarm payroll levels declined 23,000 following
a revised 24,000 decline during January. The decline compared to the
Consensus expectation for a gain of 40,000 jobs. The latest reading was
the twenty-sixth consecutive monthly decline but it was the smallest of
the period. Earlier data were revised. /p>
The rate of job loss has been slowing for a year, but a turn
to positive territory isn't yet at hand. The latest report from the
payroll processor ADP, in their National Employment Report, indicated
that February private nonfarm payroll levels declined 23,000 following
a revised 24,000 decline during January. The decline compared to the
Consensus expectation for a gain of 40,000 jobs. The latest reading was
the twenty-sixth consecutive monthly decline but it was the smallest of
the period. Earlier data were revised. /p>
ADP compiled the estimate from its database of individual companies' payroll information. Macroeconomic Advisers, LLC, the St. Louis economic consulting firm, developed the methodology for transforming the raw data into an economic indicator.
The U.S. Bureau of Labor Statistics will report February payroll employment this Friday. For comparison, the January decline of 24,000 in ADP's measure of private nonfarm payrolls was accompanied by a similar loss of 18,000 jobs in the BLS measure of private sector payrolls.
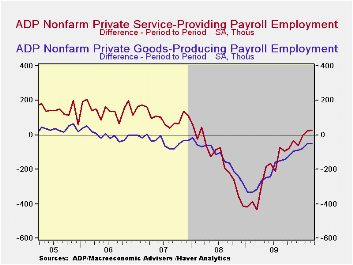
According to ADP and Macro-Advisers, the correlation between the monthly percentage change in the ADP estimate and that in the BLS data is 0.90.ADP reported that private service-producing industry employment rose for the second consecutive month with a gain of 28,000 (-1.3% y/y). Small-sized payrolls grew 15,000 (-0.9% y/y) while medium-sized payrolls grew 10,000 (-1.4% y/y). These increases were accompanied by a 3,000 increase (-1.9% y/y) in large service producing payrolls.
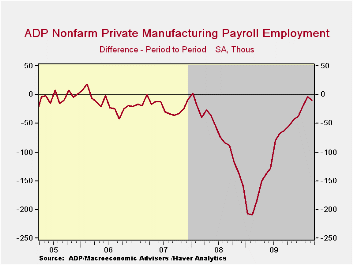
In the goods producing sector employment fell another 51,000 during February (-8.7% y/y) but the three-month annual rate of change eased again to -3.9% versus -18.1% one year ago. Small-sized payrolls fell 27,000 (-9.4% y/y) while medium-sized payrolls fell 14,000 (-7.9% y/y). Large payrolls fell 10,000 (-9.2% y/y). In the manufacturing sector alone, payrolls fell 9,000 (-6.5% y/y). The three-month change moderated to -1.1% from -17.5% last March.
The ADP National Employment Report data is maintained in Haver's USECONdatabase; historical figures date back to December 2000. The figures in this report cover only private sector jobs and exclude employment in the public sector.The full ADP National Employment Report can be found here and the ADP methodology is explained here.
| ADP National Employment Report | February | January | December | Y/Y | 2009 | 2008 | 2007 |
|---|---|---|---|---|---|---|---|
| Total Nonfarm Private Payroll Employment (m/m Chg., 000s) | -23 | -24 | -82 | -2.6% | -4.9% | -0.7% | 1.1% |
| Small Payroll (1-49) | -12 | -19 | -35 | -2.1 | -4.1 | -0.1 | 1.8 |
| Medium Payroll (50-499) | -4 | 6 | -20 | -2.7 | -5.7 | -0.9 | 1.0 |
| Large Payroll (>500) | -7 | -11 | -27 | -3.5 | -5.6 | -1.8 | -0.2 |
by Robert Brusca March 31, 2010
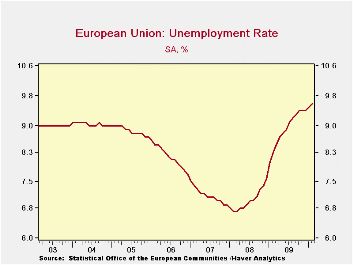
It is not so unusual for the rate of unemployment to rise early in an expansion, but this expansion has been in train for a while and the rise in the rate is a bit chilling. Taking some of the sting out of this event may be the German rate which has already been announced for March since that rate is moving lower. Still the February result for the Zone is just the sort of backsliding the EU Commission and the ECB do not want to see. Spain remains major problem.
What’s worse is that this figure is reports as the EMU inflation rate has taken a turn for the worse and is up by 1.5% Yr/Yr. Granted energy is the driving force there but given the ECB’s hyper-sensitivity to inflation and its focus on the headline rate, that inflation report was not good news.
Around the world a number of reports today showed some backsliding ranging from a reported slip in consumer confidence in the UK, poor wage data featuring sharply cut mid-year bonus payments in Japan and weak housing and retail reports from Australia. This is not enough to put at question the ongoing global recovery, but it is a bit deflating at a time that we are looking at growth ever so closely and trying to get a sustainable recovery going. Rising inflation, even if from oil prices, makes the situation even worse since everyone uses energy and faces this challenge.
| Unemployment Rate And Changes | ||||||
|---|---|---|---|---|---|---|
| Rate | Level | Simple Changes | ||||
| Feb-10 | Jan-10 | Dec-09 | 3-Mo | 6-Mo | 12-Mo | |
| EU-Urate | 9.6 | 9.5 | 9.4 | 0.2 | 0.4 | 1.3 |
| EMU-Urate | 10.0 | 9.9 | 9.9 | 0.1 | 0.4 | 1.2 |
| Unemployment rate and changes | M/M% | Changes (ar) | ||||
| EU-U 000s | 0.6% | 0.9% | 0.5% | 2.0% | 4.3% | 15.8% |
| EMU-U 000s | 0.4% | 0.7% | 0.3% | 1.4% | 3.4% | 13.3% |
| U-Rates | Level | Simple Changes | ||||
| Germany | 7.5 | 7.5 | 7.5 | 0 | -0.1 | 0.2 |
| France | 10.1 | 10 | 10 | 0.1 | 0.4 | 1.2 |
| Spain | 19 | 18.9 | 18.9 | 0 | 0.3 | 2.3 |
| USA | 9.7 | 9.7 | 10 | -0.3 | 0 | 1.5 |
| Japan | 4.9 | 4.9 | 5.2 | -0.4 | -0.5 | 0.5 |
by Tom Moeller March 31, 2010
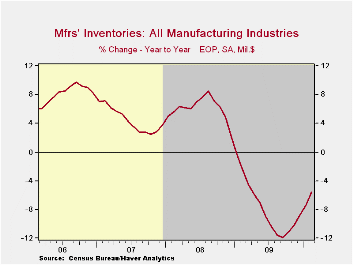
In what probably is a voluntary trend, factory inventories are accumulating. Manufacturers raised inventory levels by 0.5% last month after a 0.3% gain during January. The increase was part of a trend that has raised inventories by 0.6% during the last three months after an 8.7% drop during all of 2009. Much of that reversal reflects the upturn in oil prices which has raised inventory values held at refineries by 40.9% y/y. Excluding oil, factory inventories nevertheless rose 0.3% in February. A slight decline during the last three months contrasts with a 10.3% rate of decumulation last year. Machinery inventories slipped 0.1% and by 1.5% during the last three months versus a 13.6% decline last year. Electrical equipment inventories were roughly unchanged for the month. Their 0.3% three-month decline reverses an 18.1% drop last year. Similarly, inventories of computers & electronic products rose 0.6% and by 0.8% during the last three months after a 9.1% decline in 2009.
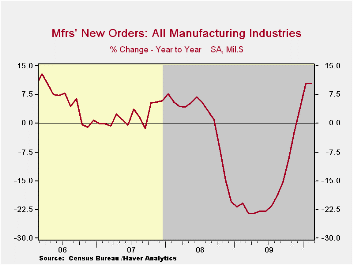
Factory orders rose 0.6% last month and by 4.6% since November after a 17.2% drop during 2009. However, the latest gain also was increased by higher oil prices. Excluding oil (where orders equal shipments), orders still were firm and rose 0.9% (7.0% y/y) after a 2.5% January increase. Orders for primary metals have been notably strong and were up by one-third y/y. Machinery orders rose 5.1% last month and their three-month change of 1.6% compares to a 25.0% drop last year. Electrical equipment orders remain under some pressure but the 3.0% decline since November is slower than a 19.2% drop during all of last year. Orders for computers & electronic products rose 1.4% during the last three months after a moderate 7.6% decline last year.
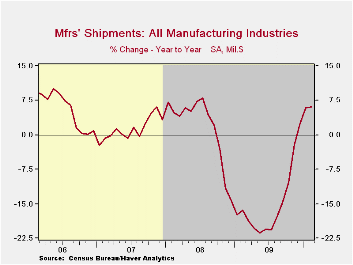
Factory shipments slipped 0.1% last month after a modest January gain. Nevertheless, the three-month gain of 2.3% follows a 15.2% drop last year. Higher oil prices played a role in the turnaround. Yet excluding oil, shipments rose 2.2% over the last three months after a 12.2% decline last year. Machinery shipments staged a reversal of 1.4% since November after the 20.1% decline in 2009. Also, a 0.4% three-month slip in shipments of electrical equipment compares to an 18.5% drop last year. Primary metals shipments increased 2.3% in February and by 10.8% since November with higher prices. Furniture shipments rose a modest 1.1% since November after the 18.9% drop last year.
The Manufacturers' Shipments, Inventories and Orders (MSIO) data are available in Haver's USECON database.
| Factory Survey (NAICS, %) | February | January | December | Y/Y | 2009 | 2008 | 2007 |
|---|---|---|---|---|---|---|---|
| Inventories | 0.5 | 0.3 | -0.2 | -5.6 | -8.7 | 2.2 | 3.7 |
| Excluding Transportation | 0.6 | 0.2 | -0.1 | -5.9 | -9.2 | -0.5 | 2.7 |
| New Orders | 0.6 | 2.5 | 1.5 | 10.5 | -17.2 | 0.0 | 1.9 |
| Excluding Transportation | 0.7 | 0.5 | 1.5 | 9.2 | -15.8 | 3.0 | 1.2 |
| Shipments | -0.1 | 0.7 | 1.8 | 6.1 | -15.2 | 1.6 | 1.2 |
| Excluding Transportation | 0.3 | 1.0 | 1.3 | 7.1 | -15.3 | 3.5 | 1.5 |
| Unfilled Orders | 0.5 | 0.2 | -0.9 | -6.5 | -10.2 | 3.4 | 17.1 |
| Excluding Transportation | 0.3 | 0.1 | 0.4 | -3.6 | -8.4 | -1.4 | 8.2 |
by Tom MoellerMarch 31, 2010
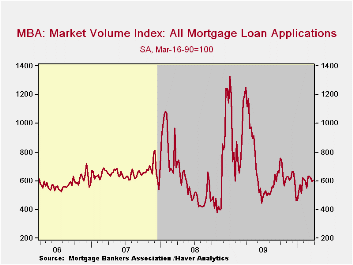
The Mortgage Bankers Association reported that while applications for refinancing were weak, purchase applications firmed during March. Overall, applications rose 2.5% this month after a 10.8% increase in February.
The gain likely has been fueled by an $8,000 Federal tax credit which is due to expire April 30. For last week, applications to purchase a home rose 8.8% in March but that followed declines during the prior two months. During the last ten years there has been a 51% correlation between the y/y change in purchase applications and the change in new plus existing single family home sales. The correlation has lessened recently. For mortgage refinancings applications were unchanged in March but they still have trended higher since mid-2009.
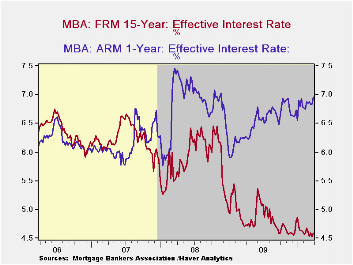
The effective fixed interest rate on conventional 15-year mortgages held roughly steady at 4.59% last week. For the month, overall rates have been near the six year low. For 30-year mortgages the rate also were steady at 5.19%. Rates reached a high of 5.79% in early-June. Interest rates on fixed 15-year and 30-year mortgages are closely correlated (near-90%) with the rate on 10-year Treasury securities. Rates on adjustable one-year mortgages rose slightly to 6.95% last week.
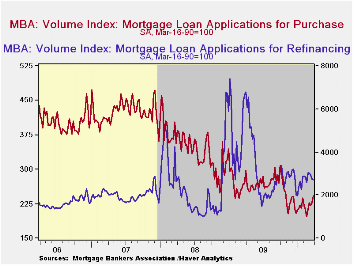
| MBA Mortgage Applications (SA, 3/16/90=100) | 03/26/10 | 03/19/10 | 03/12/10 | Y/Y | 2009 | 2008 | 2007 |
|---|---|---|---|---|---|---|---|
| Total Market Index | 602.8 | 595.0 | 620.9 | -49.5% | 736.4 | 642.9 | 652.6 |
| Purchase | 243.0 | 227.5 | 221.5 | -9.3 | 263.5 | 345.4 | 424.9 |
| Refinancing | 2,707.8 | 2,744.7 | 2,955.9 | -59.0 | 3,509.2 | 2,394.1 | 1,997.9 |
| 15-Year Mortgage Effective Interest Rate (%) | 4.59 | 4.53 | 4.60 | 4.77 (03/09) | 4.85 | 5.9 | 6.2 |

Tom Moeller
AuthorMore in Author Profile »Prior to joining Haver Analytics in 2000, Mr. Moeller worked as the Economist at Chancellor Capital Management from 1985 to 1999. There, he developed comprehensive economic forecasts and interpreted economic data for equity and fixed income portfolio managers. Also at Chancellor, Mr. Moeller worked as an equity analyst and was responsible for researching and rating companies in the economically sensitive automobile and housing industries for investment in Chancellor’s equity portfolio. Prior to joining Chancellor, Mr. Moeller was an Economist at Citibank from 1979 to 1984. He also analyzed pricing behavior in the metals industry for the Council on Wage and Price Stability in Washington, D.C. In 1999, Mr. Moeller received the award for most accurate forecast from the Forecasters' Club of New York. From 1990 to 1992 he was President of the New York Association for Business Economists. Mr. Moeller earned an M.B.A. in Finance from Fordham University, where he graduated in 1987. He holds a Bachelor of Arts in Economics from George Washington University.
More Economy in Brief


