 Global| Aug 02 2006
ADP Nat'l Employment Report: Slower Job Growth in July
by:Tom Moeller
|in:Economy in Brief
Summary
The Nat'l Employment Report, published by the payroll processor ADP, indicated that private nonfarm payrolls in July rose just 99,000. For June the increase in ADP's measure of private nonfarm payrolls of 368,000 was accompanied by a [...]
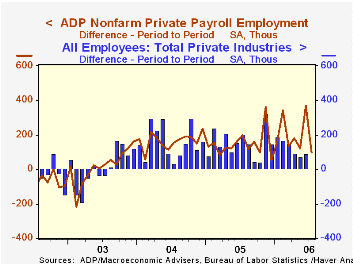
The Nat'l Employment Report, published by the payroll processor ADP, indicated that private nonfarm payrolls in July rose just 99,000.
For June the increase in ADP's measure of private nonfarm payrolls of 368,000 was accompanied by a 90,000 rise in private nonfarm payrolls as published by the Bureau of Labor Statistics. The July figure from BLS will be published this Friday.
ADP has compiled the estimate from its database of individual companies' payroll information. Macroeconomic Advisers, LLC, the St. Louis economic consulting firm, developed the methodology for transforming the raw data into an economic indicator.
According to ADP and Macro Advisers, the correlation between the monthly percentage change in the ADP estimate and that in the BLS data is 0.90.
The ADP National Employment Report data is maintained in Haver's USECON database; historical data go back to December 2000. The figures in this report cover only private sector jobs and exclude employment in the public sector, which grew an average of 11,333 per month over the last year.
The full ADP National Employment Report can be found here, and the ADP methodology is explained here.
| LAXEPA@USECON | July | June | Y/Y | 2005 | 2004 | 2003 |
|---|---|---|---|---|---|---|
| Nonfarm Private Payroll Employment (Chg.) | 99,000 | 368,000 | 2.0% | 1.7% | 1.3% | -0.4% |
by Tom Moeller August 2, 2006
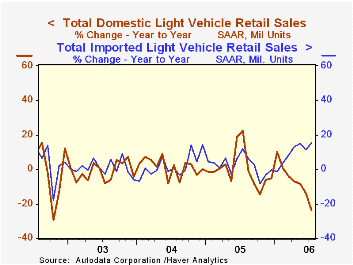
US light vehicle sales in July rose 5.8% m/m to 17.24M units, according to the Autodata Corporation. July sales were the highest since this past January and the figure beat Consensus expectations for sales of 16.6M units.
Despite the latest increase, sales fell 16.8% from July 2005 when the successful "employee pricing" plan was instituted for most car buyers.
Overall light truck sales rose 4.7% last month but a steep 28.7% decline versus July 2005 reflects both the success of last year's sales' incentives and higher gasoline prices.
Domestic truck sales rose 4.3% but fell 32.8% y/y. During the first seven month of this year sales were down 12.2% from the first seven months of 2005. Sales of the relatively fuel efficient imported light trucks rose 7.1% m/m (6.8% y/y). Year to date sales of imported light trucks rose 9.0% from the first seven months of 2005.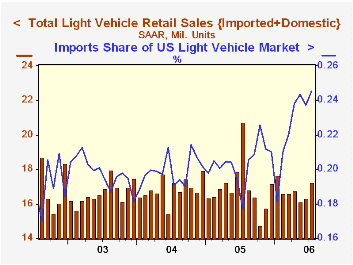
Auto sales rose 7.0% (1.9% y/y) in July. Domestic car sales turned in a 5.1% gain but still fell 5.6% from last year. Year to date sales were up 0.3% versus last year. Sales of imported autos, in contrast, surged 10.7% (20.0% y/y). Year to date imported car sales rose 9.9% from last year.
Imports garnered a 24.6% share of the US light vehicle market during July, a monthly record, versus 20.4% during all of last year.
Deficits, Debt and Trust Funds from the Federal Reserve Bank of St. Louis can be found here.
| Light Vehicle Sales (SAAR, Mil. Units) | July | June | Y/Y | 2005 | 2004 | 2003 |
|---|---|---|---|---|---|---|
| Total | 17.24 | 16.30 | -16.8% | 16.92 | 16.87 | 16.63 |
| Autos | 8.23 | 7.69 | 1.9% | 7.65 | 7.49 | 7.62 |
| Trucks | 9.01 | 8.61 | -28.7% | 9.27 | 9.37 | 9.01 |
by Tom Moeller August 2, 2006
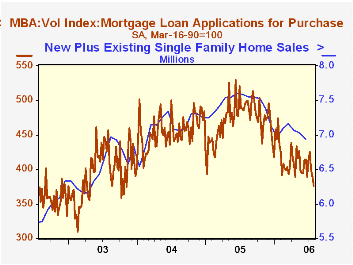
A 1.2% decline last week in the total number of mortgage applications extended the recent decline to three consecutive weeks. Applications for all of July fell 1.9% from June when applications fell 1.5% from May.
Lower purchase applications led last week's decline with 3.3% drop which pulled the July average 2.1% below June, the third consecutive down month.
During the last ten years there has been a 58% correlation between the y/y change in purchase applications and the change in new plus existing single family home sales.
Applications to refinance added 2.3% to the prior week's 0.6% recovery to limit the decline during all of July to 1.8% versus June. Refis fell 3.1% during June from the May average.
The effective interest rate on a conventional 30-year mortgage fell nine basis points w/w to 6.82%. The peak for 30 year financing was 7.08% late in June. The rate on 15-year financing also fell to 6.53% and the peak rate was 6.75%. Interest rates on 15 and 30 year mortgages are closely correlated (>90%) with the rate on 10 year Treasury securities.
During the last ten years there has been a (negative) 79% correlation between the level of applications for purchase and the effective interest rate on a 30-year mortgage.
In July, 35.4% of all loan applications were to refinance, down from 44.2% last July.
The Mortgage Bankers Association surveys between 20 to 35 of the top lenders in the U.S. housing industry to derive its refinance, purchase and market indexes. The weekly survey accounts for more than 40% of all applications processed each week by mortgage lenders. Visit the Mortgage Bankers Association site here.
| MBA Mortgage Applications (3/16/90=100) | 07/28/06 | 07/21/06 | Y/Y | 2005 | 2004 | 2003 |
|---|---|---|---|---|---|---|
| Total Market Index | 527.6 | 533.8 | -29.8% | 708.6 | 735.1 | 1,067.9 |
| Purchase | 376.2 | 389.0 | -23.9% | 470.9 | 454.5 | 395.1 |
| Refinancing | 1,417.2 | 1,385.2 | -37.0% | 2,092.3 | 2,366.8 | 4,981.8 |
by Carol Stone August 2, 2006
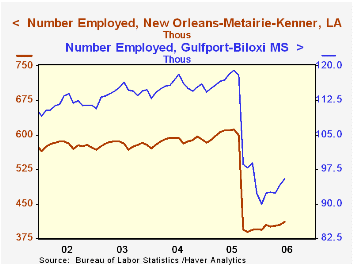
As the first potential hurricane of 2006, Chris, forms near the Dominican Republic and Cuba, we are reminded, of course, of the drastic impact of last year's Katrina. This morning, the BLS released the household survey data for June for metropolitan areas, and we can get an assessment of economic conditions now in some of the affected cities. These data are carried in Haver's EMPLR database. Series for labor force, employment, unemployment and the unemployment rate are included for hundreds of metro areas, micro areas, and the other standard combinations of urban communities in all 50 States, the District of Columbia and Puerto Rico.
In New Orleans, the center of Katrina's damage, the number of people employed is up about 25,000 from its October low, but is clearly still well off the pre-storm numbers. Unemployment, while not at the extreme of October, remains higher than 2003 and 2004, suggesting that even with a reduced labor force, job opportunities are not relatively as plentiful.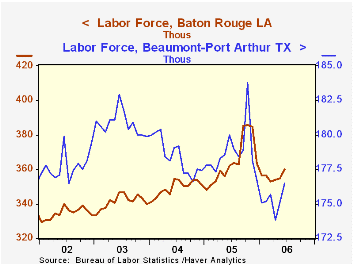
Gulfport-Biloxi is also continuing to face strained economic conditions. Unemployment remains far higher than before and also higher than in New Orleans, even though the unemployment rates in the two areas were about the same in the 2003-04 period.
Other cities in the region are doing better. Baton Rouge, the State Capital, saw its unemployment rate shoot up immediately after Katrina, as workers from New Orleans poured into the area. As seen in the table, the rate rose even as the number of employed persons expanded by slightly more than 10,000. Since then, however, employment has fallen back to its pre-storm level and so has unemployment, as the transient workers apparently returned home or moved on.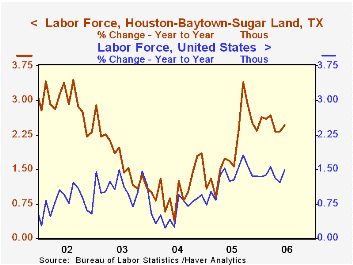
Cities in Texas also received people from the storm-damaged region. Beaumont-Port Arthur, very near the Louisiana state line, experienced a spike in its labor force and its unemployment rate, but this dissipated. Presently, employment is running about the same as in 2004 and 2005, and the unemployment rate is actually somewhat lower than previously.
Finally, in Houston, the labor force expanded by 25,400 in September and for the most part, these people stayed. Employment rose even more and unemployment fell. Only in June did some of this labor market vigor fade a bit, with a somewhat larger-than-normal June rise in the unemployment rate. So Houston generally was able to absorb its new workers and find jobs for them, and the labor force in Houston is nearly 2.5% larger than a year ago, compared with 1.5% in the nation as a whole.
| Employment, NSA, Thous | June 2006 | May 2006 | Oct 2005 | June 2005 | 2005 | 2004 | 2003 |
|---|---|---|---|---|---|---|---|
| New Orleans, LA* | 412.0 | 404.5 | 388.5 | 610.9 | n.m. | 587.6 | 578.7 |
| Unemployment Rate (%) | 7.2 | 6.4 | 17.1 | 6.1 | n.m. | 5.1 | 5.5 |
| Gulfport-Biloxi, MS | 95.4 | 94.1 | 97.9 | 118.4 | n.m. | 115.5 | 114.1 |
| Unemployment Rate (%) | 12.5 | 12.9 | 21.2 | 6.9 | n.m. | 5.2 | 5.1 |
| Baton Rouge, LA | 341.0 | 339.3 | 348.3 | 338.2 | n.m. | 329.7 | 319.9 |
| Unemployment Rate (%) | 5.3 | 4.4 | 9.7 | 6.7 | n.m. | 5.9 | 6.3 |
| Beaumont-Port Arthur, TX | 164.0 | 164.1 | 163.2 | 166.4 | 164.9 | 163.6 | 165.0 |
| Unemployment Rate (%) | 7.1 | 6.3 | 11.2 | 7.6 | 7.7 | 8.3 | 8.8 |
| Houston, TX* | 2544.0 | 2532.2 | 2521.0 | 2480.3 | 2484.4 | 2419.1 | 2379.2 |
| Unemployment Rate (%) | 5.6 | 5.0 | 5.4 | 5.7 | 5.5 | 6.2 | 6.8 |

Tom Moeller
AuthorMore in Author Profile »Prior to joining Haver Analytics in 2000, Mr. Moeller worked as the Economist at Chancellor Capital Management from 1985 to 1999. There, he developed comprehensive economic forecasts and interpreted economic data for equity and fixed income portfolio managers. Also at Chancellor, Mr. Moeller worked as an equity analyst and was responsible for researching and rating companies in the economically sensitive automobile and housing industries for investment in Chancellor’s equity portfolio. Prior to joining Chancellor, Mr. Moeller was an Economist at Citibank from 1979 to 1984. He also analyzed pricing behavior in the metals industry for the Council on Wage and Price Stability in Washington, D.C. In 1999, Mr. Moeller received the award for most accurate forecast from the Forecasters' Club of New York. From 1990 to 1992 he was President of the New York Association for Business Economists. Mr. Moeller earned an M.B.A. in Finance from Fordham University, where he graduated in 1987. He holds a Bachelor of Arts in Economics from George Washington University.
More Economy in Brief


