 Global| Aug 08 2006
2Q U.S. Productivity Up 1.1%, Costs Accelerated
by:Tom Moeller
|in:Economy in Brief
Summary
Non-farm labor productivity growth last quarter slowed to 1.1% from the heady, upwardly revised 4.3% growth rate during 1Q. The gain was slightly ahead of Consensus expectations for 0.8% growth. Revisions extended back to 2003. Due to [...]
Non-farm labor productivity growth last quarter slowed to 1.1% from the heady, upwardly revised 4.3% growth rate during 1Q. The gain was slightly ahead of Consensus expectations for 0.8% growth.
Revisions extended back to 2003. Due to less output growth, as highlighted by the downward revision to GDP reported in July, productivity also was lowered to 2.3% in 2005 from 2.7% estimated initially, to 3.0% in 2004 from 3.4% and to 3.7% in 2003 from 3.9%.
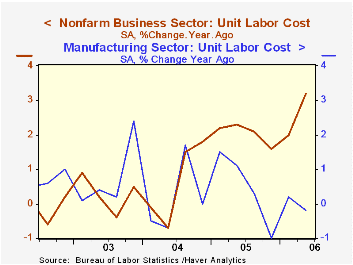
Upward pressure on unit labor costs intensified due to slower productivity growth and faster growth in compensation per hour. Unit labor costs grew 4.2% last quarter, up from a 2.5% increase during 1Q. The 3.3% average rate of advance so far this year rose from 2.0% growth last year. Revisions actually lowered slightly the annual growth in costs from 2004 to 2005.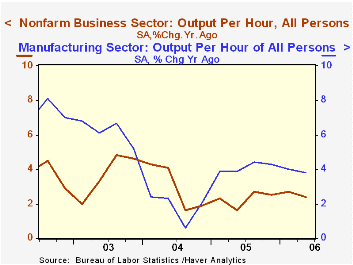
Compensation jumped 5.4% after a 6.4% 1Q gain and the 6.1% two-quarter average rate of increase is the fastest in three years. Part of the acceleration is due to downward revisions to compensation growth during 2005 and 2004.
Factory sector productivity grew 3.0% (3.8% y/y) after a 3.7% 1Q increase. Revisions to factory sector productivity also were downward. Compensation growth also was strong last quarter after downward revision to prior years' growth. Factory sector compensation per hour rose 1.7% (3.6% y/y) after a 5.2% 1Q increase that was more than double last month's estimate.
Unit labor costs in the factory sector nevertheless remained under control. Costs fell 1.2% (-0.2% y/y) after a 1.4% 1Q rise. The stability of recent labor cost pressures compares with a 0.5% gain during 2005 revised from 1.7%, and a 0.1% gain during 2004 revised from -3.1%.Colleges Need To Learn about Productivity a speech by Fed Bank President William Poole is available here.
| Non-farm Business Sector (SAAR) | 2Q' 06 | 1Q '06 | Y/Y | 2005 | 2004 | 2003 |
|---|---|---|---|---|---|---|
| Output per Hour | 1.1% | 4.3% | 2.4% | 2.3% | 3.0% | 3.7% |
| Compensation per Hour | 5.4% | 6.4% | 5.7% | 4.4% | 3.6% | 4.0% |
| Unit Labor Costs | 4.2% | 2.5% | 3.2% | 2.0% | 0.7% | 0.3% |
by Tom Moeller August 8, 2006
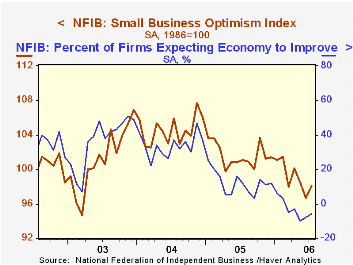
Small business optimism last month recovered most of the June decline with a 1.4% rise, according to the National Federation of Independent Business (NFIB). Nevertheless, the average level of the NFIB index this year remained 2.5% below the 2005 average.
During the last ten years there has been a 70% correlation between the level of the NFIB index and the two quarter change in real GDP.
Respondents expecting the economy to improve rose modestly m/m but remained near the lowest level since early 2001.
The percentage of firms planning to increase employment improved markedly m/m but the number of firms currently with one or more job openings slipped. During the last ten years there has been a 72% correlation between the NFIB percentage and the y/y change in nonfarm payrolls.
The percent planning to raise capital expenditures rose to 31%, about the same as last year..The percentage of firms planning to raise average selling prices rose back to 30% and the percentage of firms actually raising prices was stable m/m at 23%. During the last ten years there has been a 60% correlation between the change in the producer price index and the level of the NFIB price index.
About 24 million businesses exist in the United States. Small business creates 80% of all new jobs in America.
| Nat'l Federation of Independent Business | July | June | Y/Y | 2005 | 2004 | 2003 |
|---|---|---|---|---|---|---|
| Small Business Optimism Index (1986=100) | 98.1 | 96.7 | -3.0% | 101.6 | 104.6 | 101.3 |
by Tom Moeller August 8, 2006
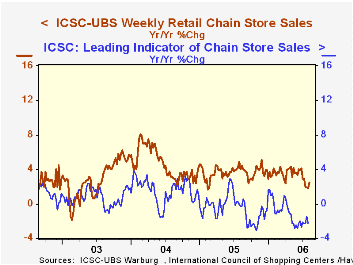
Weekly chain store sales slipped 0.2% last week after two weeks of moderate increase, according to the International Council of Shopping Centers (ICSC)-UBS survey.
Sales in early August started the month 0.4% above the July average which fell 0.6% from June. During the last ten years there has been a 47% correlation between the y/y change in chain store sales and the change in nonauto retail sales less gasoline.The ICSC-UBS retail chain-store sales index is constructed using the same-store sales (stores open for one year) reported by 78 stores of seven retailers: Dayton Hudson, Federated, Kmart, May, J.C. Penney, Sears and Wal-Mart.
The leading indicator of chain store sales from ICSC-UBS fell another 0.4% (-2.2% y/y) in the latest week. It was the third decline in the last four weeks.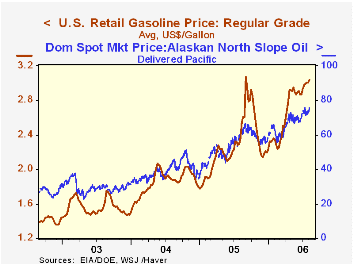 Retail gasoline prices opened the month with a three cent rise to $3.04 (28.3% y/y) for regular unleaded gas compared to a July average of $2.98. In spot market trading yesterday, gasoline prices fell moderately but the shutdown of supplies from Prudhoe Bay lifted Alaskan North Slope prices $2.22 to $75.68 per barrel (22.4% y/y).
The new Short-Term Energy Outlook from the U.S. Energy Information Administration is available here.
| ICSC-UBS (SA, 1977=100) | 08/05/06 | 07/29/06 | Y/Y | 2005 | 2004 | 2003 |
|---|---|---|---|---|---|---|
| Total Weekly Chain Store Sales | 470.2 | 471.2 | 2.5% | 3.6% | 4.7% | 2.9% |
by Louise Curley August 8, 2006
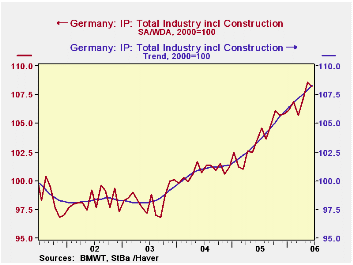
Contrary to expectations, industrial production in Germany fell 0.4% to 108.2 (2000=100) in June from 108.6 in May. While there is reason to believe that high oil prices and the strength of the euro will eventually, slow world demand for German goods and hence, production, the decline in production in June has not been large enough to change the underlying positive trend. The trend in production computed and published by the German Statistical Office is shown in the first chart together with the seasonally and working day adjusted data. The trend value for June is 108.3, compared with 107.9 for May.
In the emerging countries, Hungary, Slovakia and Turkey, industrial production continues to forge ahead. Production in Slovakia was up 0.21% in June from May, in Hungary, 1.78% and in Turkey, 2.20%. In all three countries, industrial production in June averaged 10-12% above June, 2005 in contrast with Germany's whose year over year growth in production was 4.5%. The contrast between the growth in industrial production in Turkey and in Germany is shown in the second chart and the similarity between the growth in production in Slovakia and Hungary is shown in the third chart.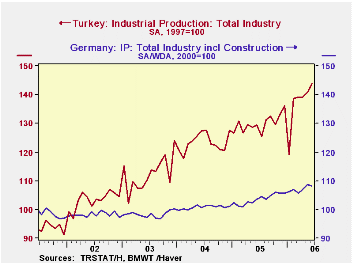
Indexes only tell us how a particular level of a series varies from a base value. Thus, the 108.2 of industrial production in Germany in June only tells us that production is 8.2% above whatever the average level of production in 2000 was. If we want absolute values that are comparable, we have to look elsewhere. To compare the sizes of these four countries we have chosen to use the GDP expressed in constant prices and constant exchange rates.. For the three emerging countries this value is listed in the National Account Section of each country in terms of 1995 prices and 1995 exchange rate. In the case of Germany, this value is given in the G10 Data Base and is in terms of 2000 prices and exchange rate.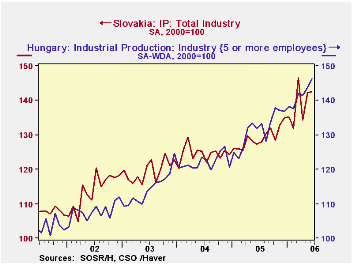
In 2005, the dollar value at constant exchange rates of real GDP in Germany was $1,972 billion; for Turkey, $259 billion; Hungary, $67 billion; and Slovakia, $26 billion. In 2000, the comparable dollar values were $1,904 billion for Germany; Turkey, $210 billion; Hungary, $55 billion; and Slovakia, $20 billion. The percentage changes between 2000 and 2005 were 3.6% for Germany, 23.5% for Turkey, 22.7% for Hungary and 23.2% for Slovakia.
| Industrial Production (2000=100) | Jun 06 | May 06 | Jun 05 | M/M % | Y/Y % | 2005 | 2004 | 2003 |
|---|---|---|---|---|---|---|---|---|
| Germany | 108.2 | 108.6 | 103.5 | -0.37 | 4.54 | 103.7 | 100.8 | 98.4 |
| Trend | 108.3 | 107.9 | 102.3 | 0.37 | 4.84 | 103.6 | 100.9 | 98.5 |
| Slovakia | 142.6 | 142.3 | 127.4 | 0.21 | 11.93 | 129.1 | 124.6 | 119.6 |
| Hungary | 143.1 | 140.6 | 129.5 | 1.78 | 10.50 | 129.9 | 120.9 | 113.3 |
| Turkey * | 139.1 | 136.1 | 125.0 | 2.20 | 11.29 | 125.7 | 119.3 | 108.7 |
by Tom Moeller August 8, 2006
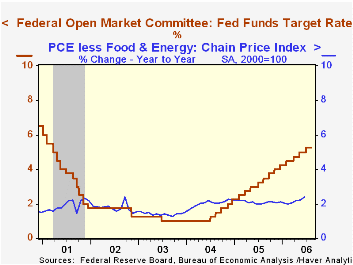
The Federal Open Market Committee held steady the target interest rate for Federal funds at 5.25% at today's meeting. Voting against the decision, after seventeen 25 basis point increases since June 2004, was Jeffrey M. Lacker who preferred an increase of 25 basis points in the federal funds rate target.
The discount rate also held steady at 6.25%.
Today's decision was widely expected by analysts.
The Fed's rationale for leaving rates unchanged was that "Economic growth has moderated from its quite strong pace earlier this year, partly reflecting a gradual cooling of the housing market and the lagged effects of increases in interest rates and energy prices."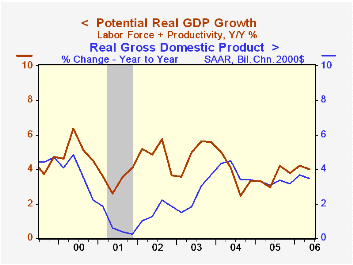
Moreover, "... inflation pressures seem likely to moderate over time, reflecting contained inflation expectations and the cumulative effects of monetary policy actions and other factors restraining aggregate demand."
For the complete text of the Fed's latest press release please follow this link.
The accompanying chart plots the U.S. economy's actual rate of growth versus its so called "potential", i.e., growth in the labor force plus the growth in labor's productivity. The figures are updated for this morning's downward revisions to recent productivity and indicate that GDP growth of 3.5% trailed its potential of 4.0%.
The Taylor Rule: A Guidepost for Monetary Policy? from the Federal Reserve Bank of Cleveland can be found here.
Monetary Policy in a Global Environment from the Federal Reserve Bank of San Francisco is available here.

Tom Moeller
AuthorMore in Author Profile »Prior to joining Haver Analytics in 2000, Mr. Moeller worked as the Economist at Chancellor Capital Management from 1985 to 1999. There, he developed comprehensive economic forecasts and interpreted economic data for equity and fixed income portfolio managers. Also at Chancellor, Mr. Moeller worked as an equity analyst and was responsible for researching and rating companies in the economically sensitive automobile and housing industries for investment in Chancellor’s equity portfolio. Prior to joining Chancellor, Mr. Moeller was an Economist at Citibank from 1979 to 1984. He also analyzed pricing behavior in the metals industry for the Council on Wage and Price Stability in Washington, D.C. In 1999, Mr. Moeller received the award for most accurate forecast from the Forecasters' Club of New York. From 1990 to 1992 he was President of the New York Association for Business Economists. Mr. Moeller earned an M.B.A. in Finance from Fordham University, where he graduated in 1987. He holds a Bachelor of Arts in Economics from George Washington University.
More Economy in Brief


