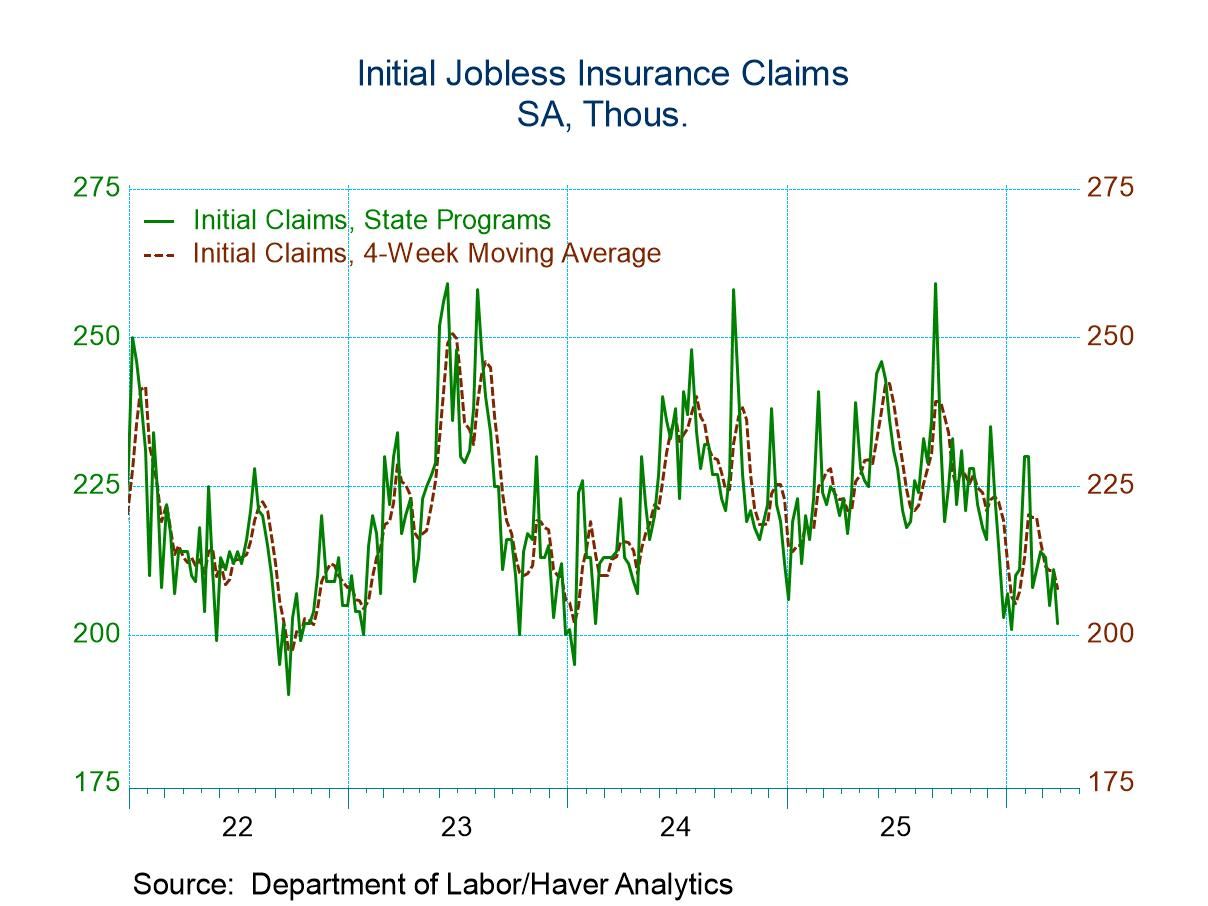
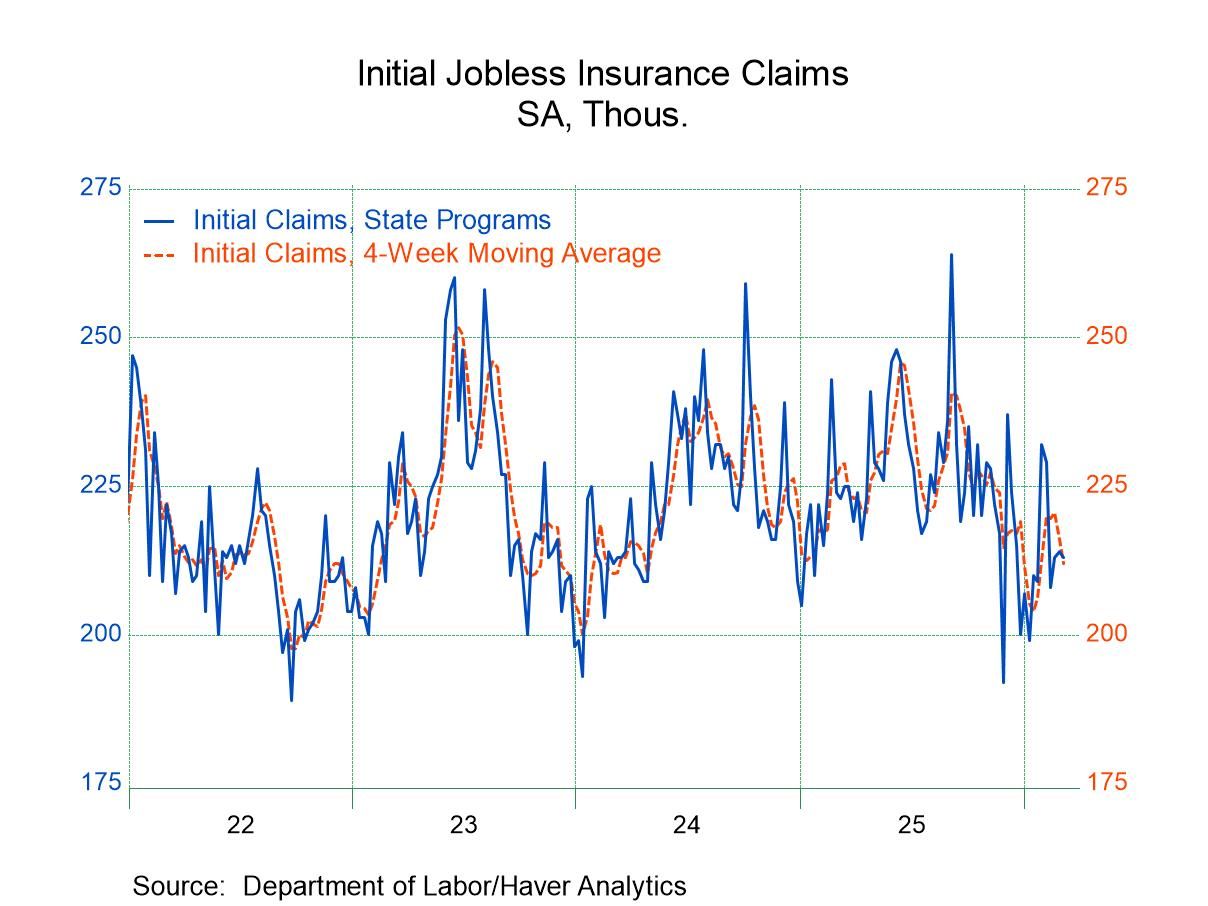
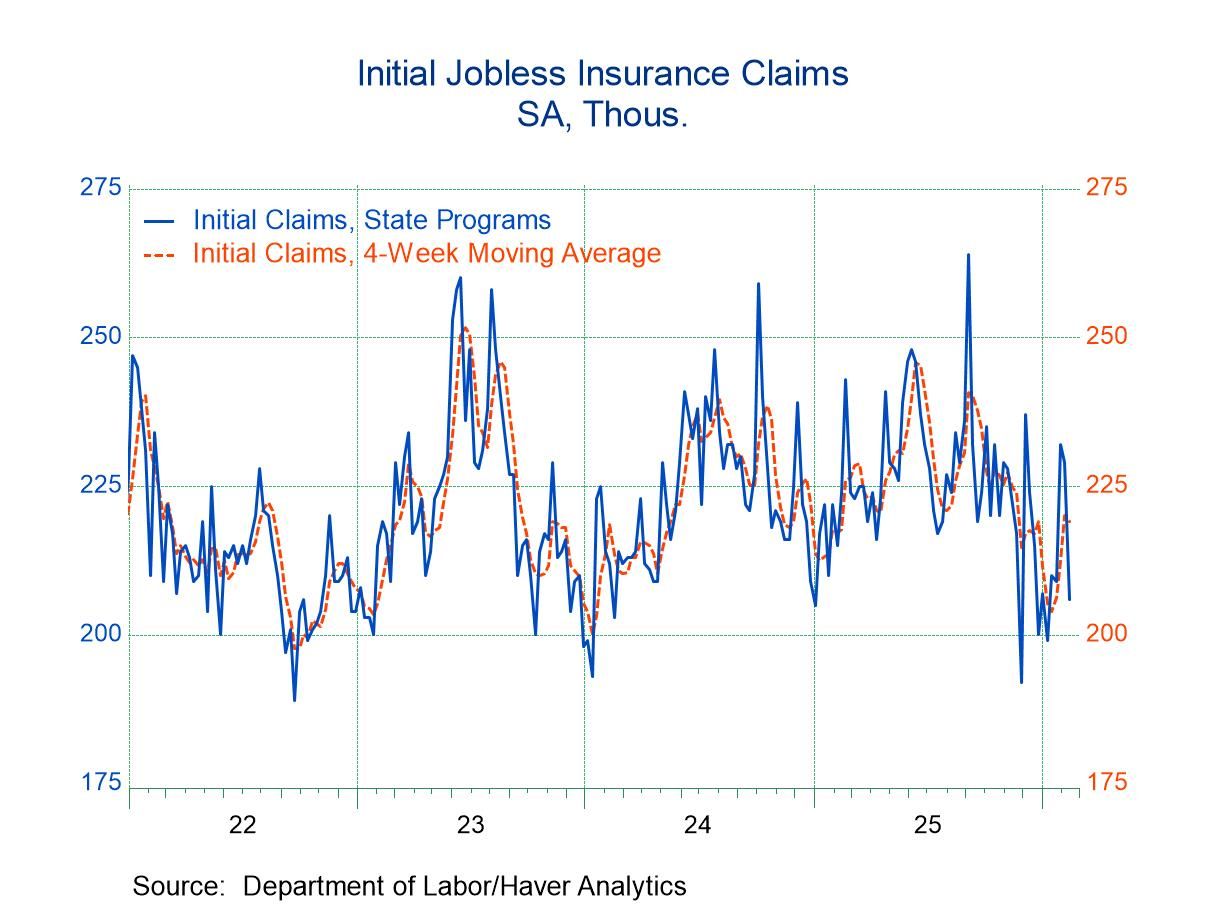
- New claims declined by 9,000 to 202,000.
- Continuing claims rose by 25,000 to 1.841 million.
- The insured unemployment rate remained at 1.2%.
Introducing
Kathleen Stephansen, CBE
in:Our Authors
Kathleen Stephansen is a Senior Economist for Haver Analytics and an Independent Trustee for the EQAT/VIP/1290 Trust Funds, encompassing the US mutual funds sponsored by the Equitable Life Insurance Company. She is a former Chief Economist of Huawei Technologies USA, Senior Economic Advisor to the Boston Consulting Group, Chief Economist of the American International Group (AIG) and AIG Asset Management’s Senior Strategist and Global Head of Sovereign Research. Prior to joining AIG in 2010, Kathleen held various positions as Chief Economist or Head of Global Research at Aladdin Capital Holdings, Credit Suisse and Donaldson, Lufkin and Jenrette Securities Corporation.
Kathleen serves on the boards of the Global Interdependence Center (GIC), as Vice-Chair of the GIC College of Central Bankers, is the Treasurer for Economists for Peace and Security (EPS) and is a former board member of the National Association of Business Economics (NABE). She is a member of Chatham House and the Economic Club of New York. She holds an undergraduate degree in economics from the Universite Catholique de Louvain and graduate degrees in economics from the University of New Hampshire (MA) and the London School of Economics (PhD abd).

Publications by Kathleen Stephansen, CBE
 USA| Apr 01 2026
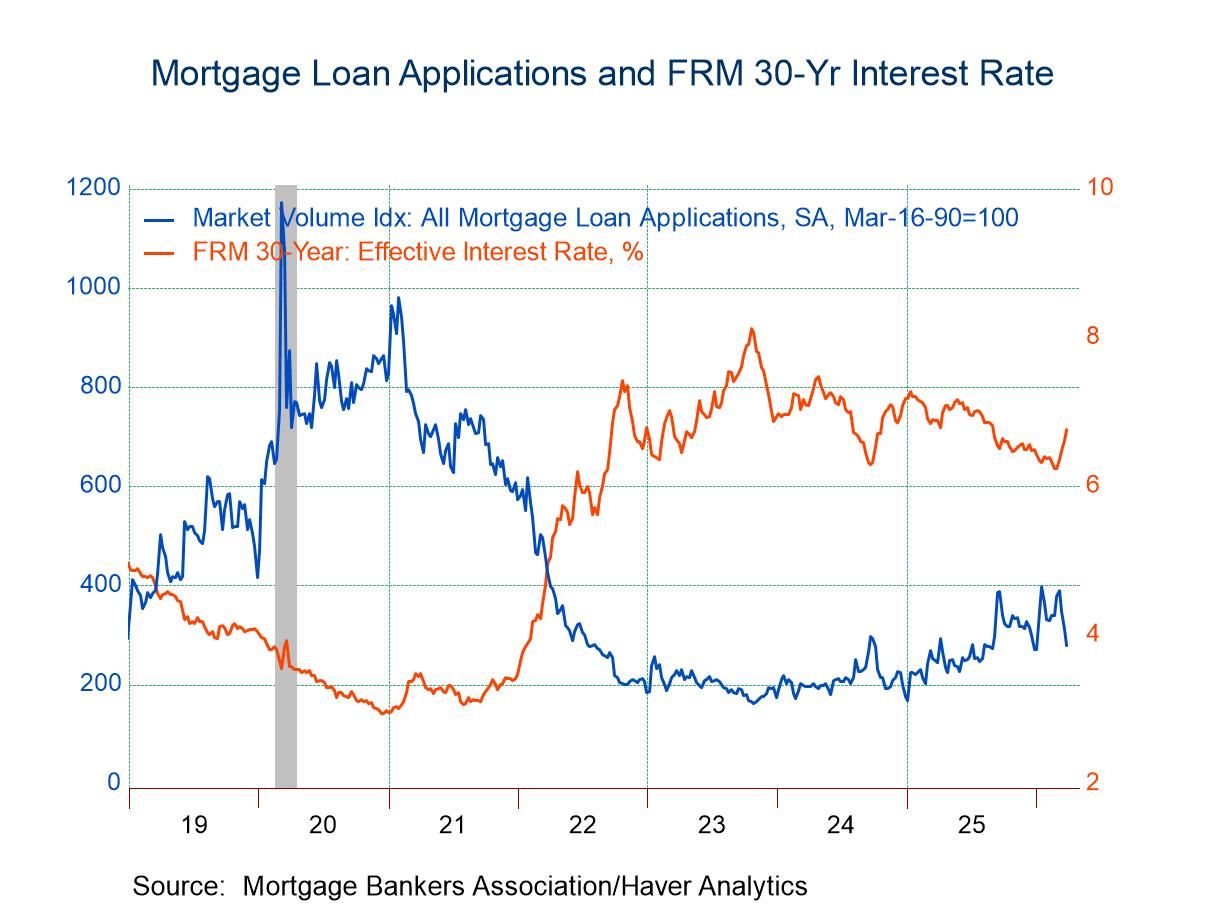
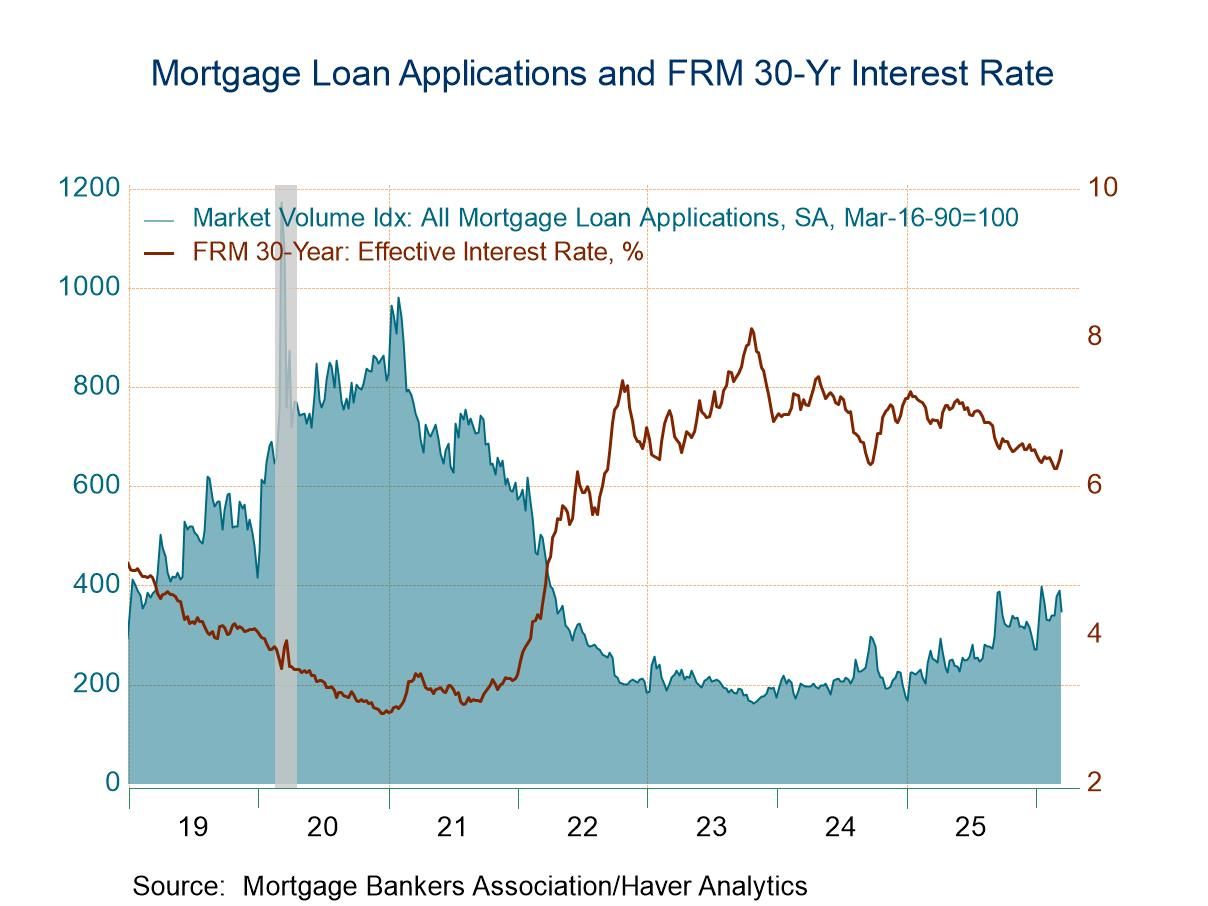
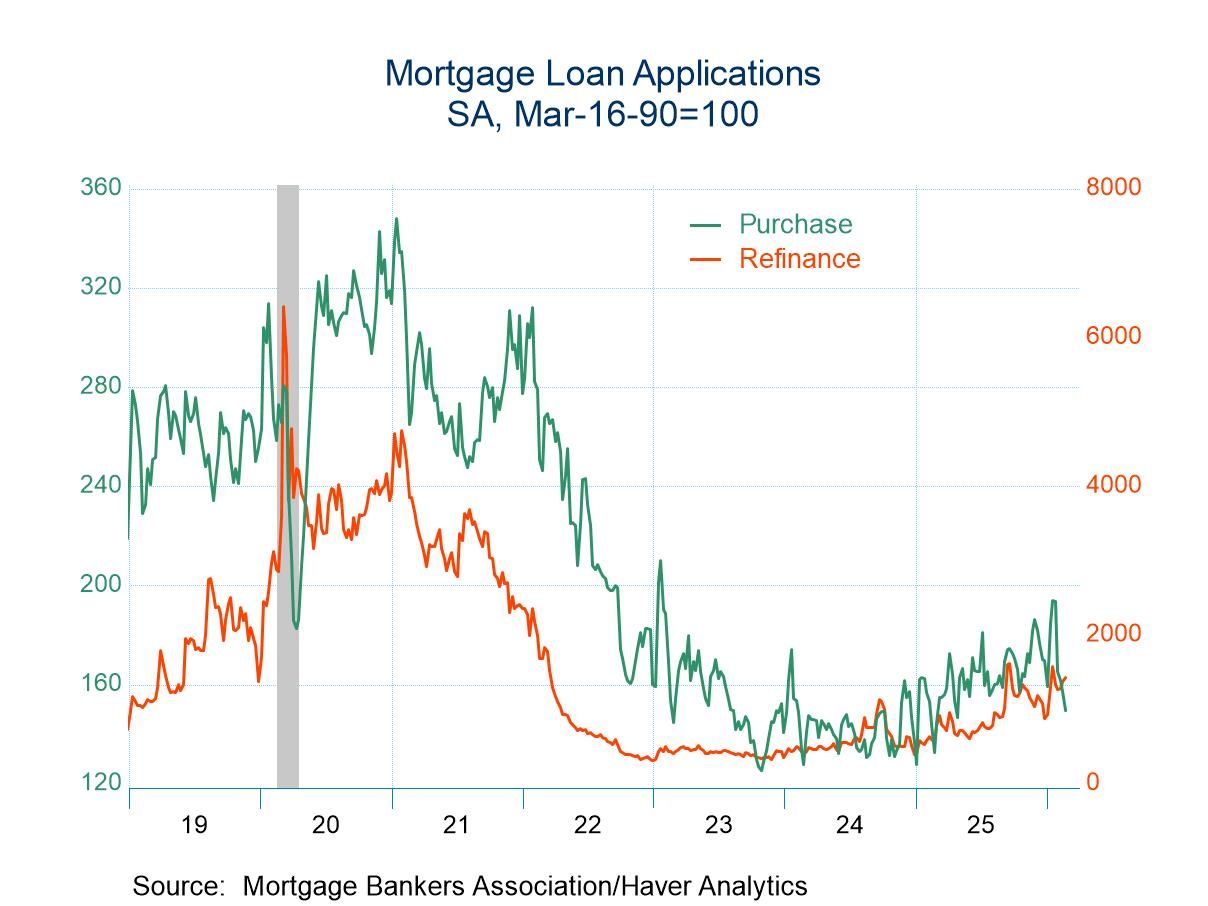
U.S. Mortgage Applications Dropped in the March 27 Week
- Both applications for loans to purchase and for loan refinancing dropped in the latest week.
- Interest rate on 30-year fixed-rate loans rose 14bps to 6.76%
- Average loan size declined.

- New claims rose by 5,000 to 210,000.
- Continuing claims declined by 32,000 to 1.819 million, the lowest level for insured unemployment since May 25, 2024.
- The insured unemployment rate remained at 1.2%.
 USA| Mar 25 2026
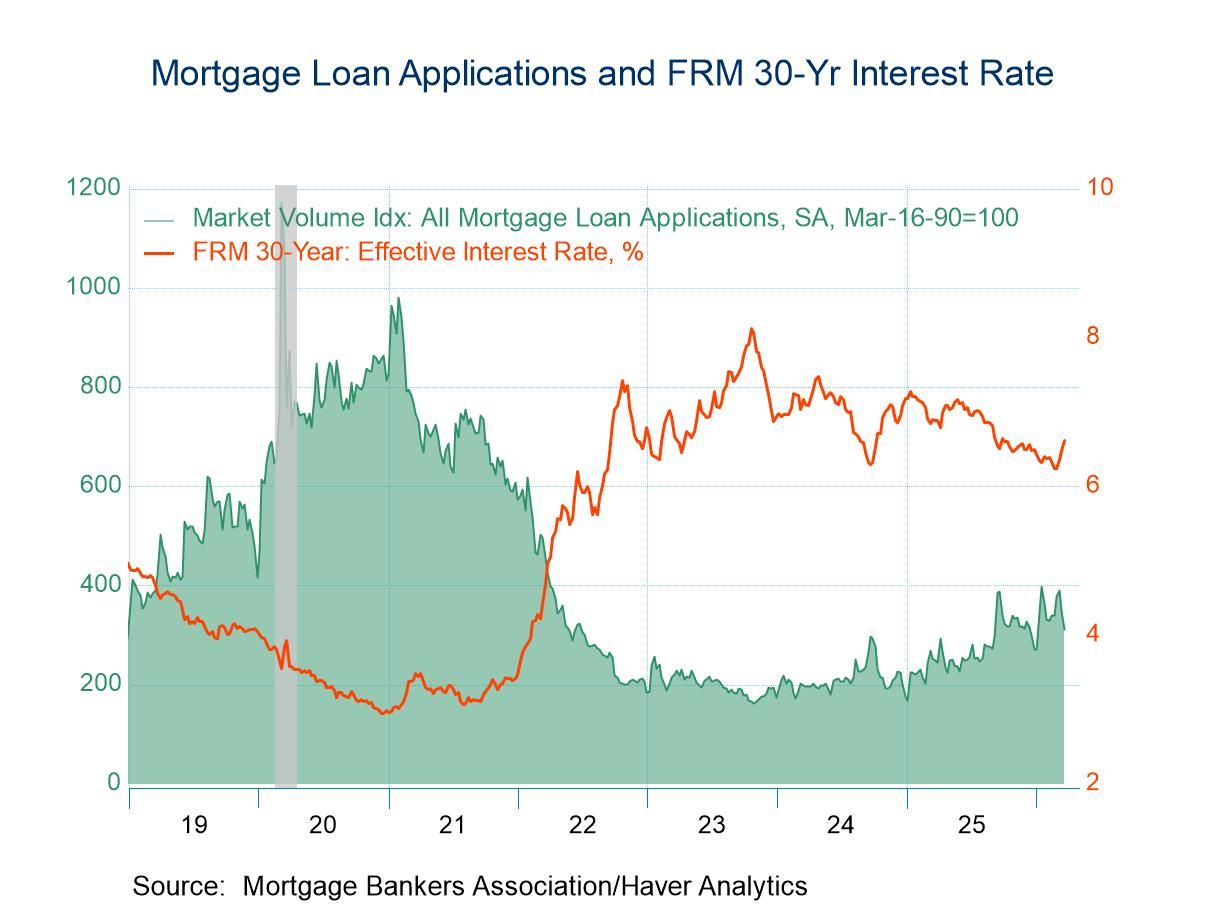
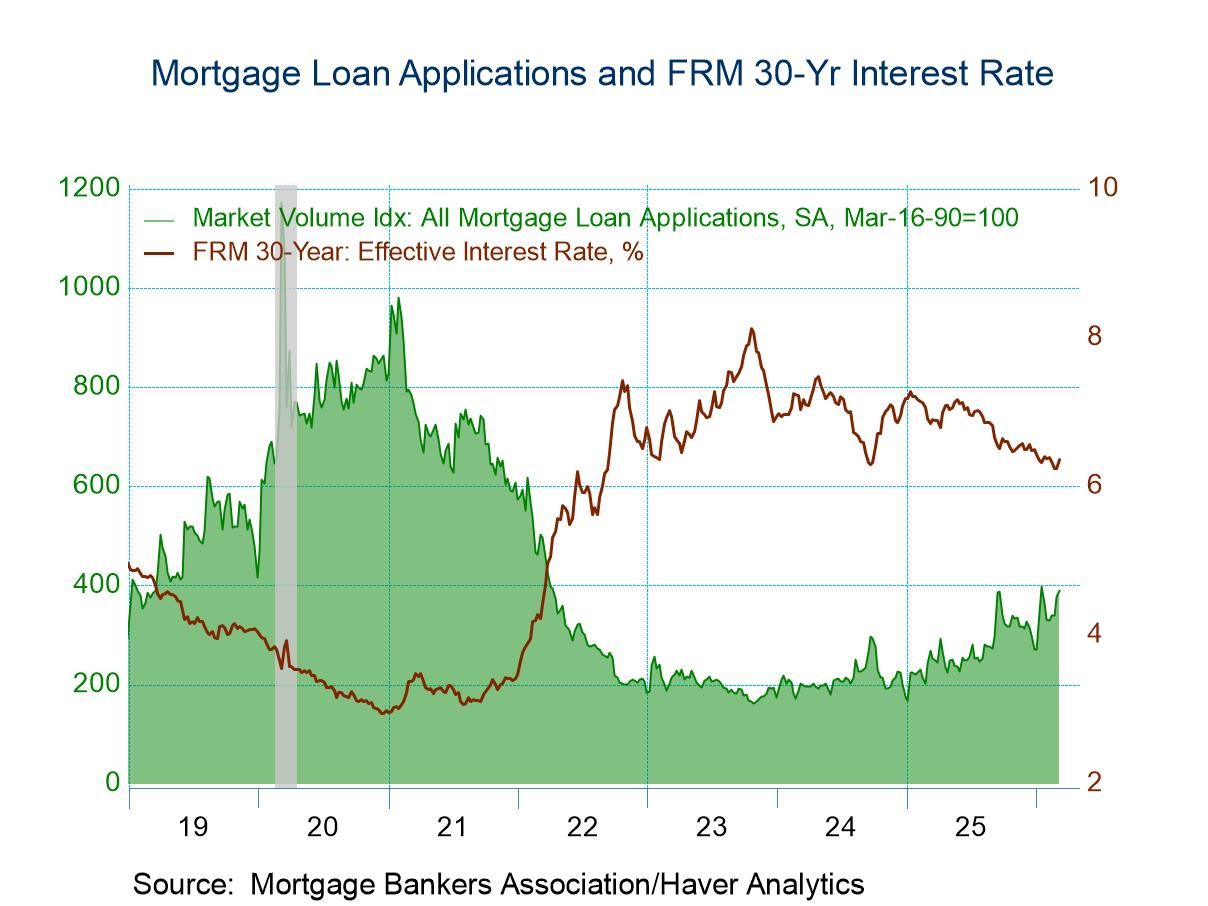
U.S. Mortgage Applications Dropped in the March 20 Week
- Both applications for loans to purchase and for loan refinancing dropped in the latest week.
- Double-digit basis-point rises in all interest rates.
- Average loan size declined.
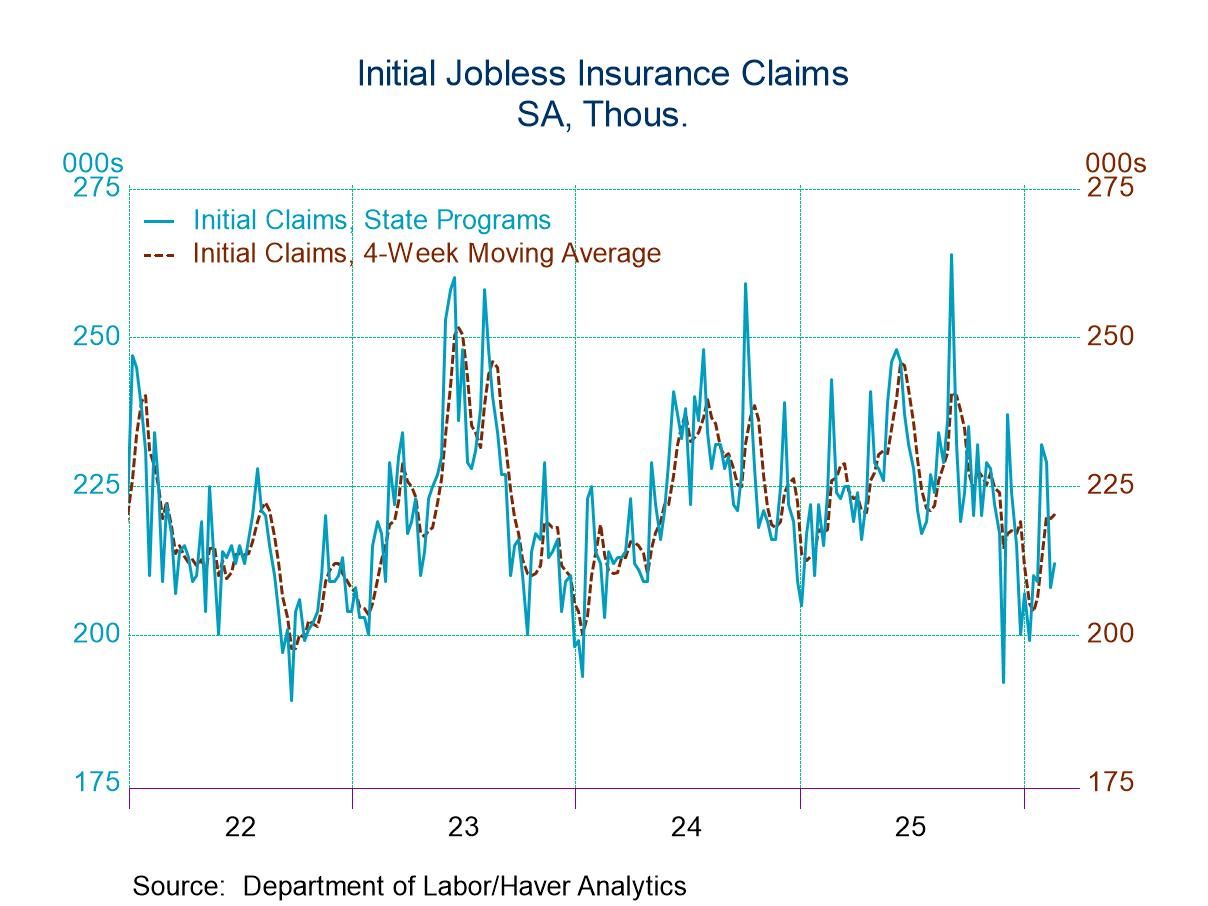
- New claims declined by 8,000 to 205,000.
- Continuing claims rose by 10,000 to 1.857 million
- The insured unemployment rate remained at 1.2%.
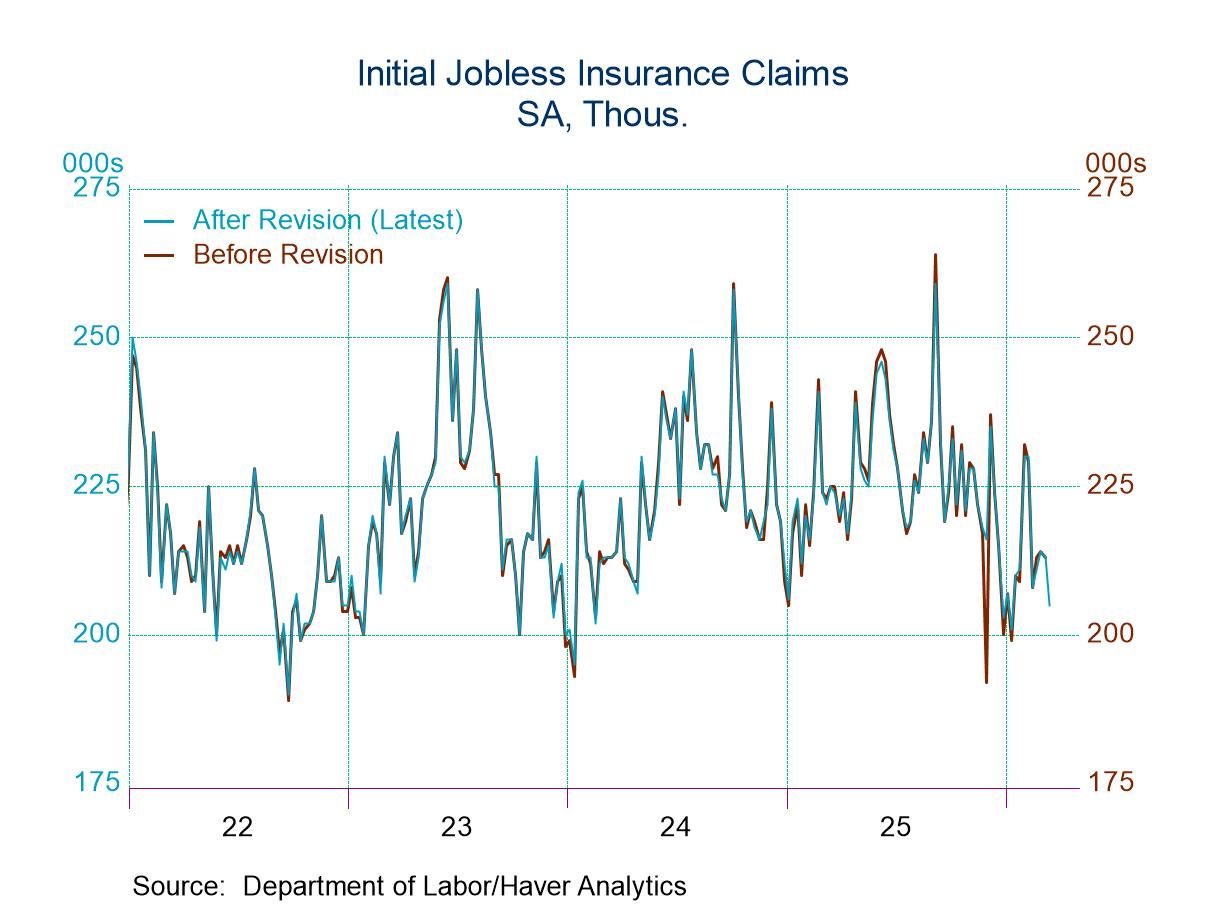
- The annual revision to the claims seasonal factors reflects minor changes in the claims series over the past year, with one notable upward revision to the November 29 week, when claims were revised from 192,000 to 216,000.
 USA| Mar 18 2026
U.S. Mortgage Applications Dropped in the March 13 Week
- Applications for loans to purchase edged up, while applications for loan refinancing plummeted.
- Effective interest rate on 30-year fixed loans rose 12bps to 6.48%.
- Average loan size declined.
- New claims dipped by 1,000 to 213,000.
- Continuing claims declined by 21,000 to 1.850 million.
- The insured unemployment rate remained at 1.2%.
 USA| Mar 11 2026
U.S. Mortgage Applications Rose Again in the March 6 Week
- Both applications for loans to purchase and for loan refinancing rose.
- Effective interest rate on 30-year fixed loans rose 12bps to 6.36%.
- Average loan size declined.
 USA| Feb 26 2026
U.S. Initial Unemployment Claims Rose in Latest Week
- New claims rose by 4,000 to 212,000.
- Continuing claims declined by 31,000 to 1.833 million.
- The insured unemployment rate remained at 1.2% for the 12th consecutive week.
 USA| Feb 25 2026
U.S. Mortgage Applications Edged Up in the February 20
- Applications for loans to purchase declined in the latest week while refinancing loan applications rose.
- Effective interest rate on 30-year fixed loans declined 9bp to 6.24%.
- Average loan size edged up.
 USA| Feb 19 2026
U.S. Initial Unemployment Claims Declined in Latest Week
- New claims dropped by 23,000 to 206,000.
- Continuing claims rose by 17,000 to 1.869 million.
- The insured unemployment rate remained at 1.2% for the 11th consecutive week.
 USA| Feb 18 2026
U.S. Mortgage Applications Rose in the February 13 Week
- Applications for loans to purchase declined in the latest week while refinancing loan applications rose.
- Effective interest rate on 30-year fixed loans declined 5bp to 6.33%.
- Average loan size rose.
- of20Go to 2 page