 Global| Nov 02 2006
U.S. Vehicle Sales Retraced Earlier Increase
by:Tom Moeller
|in:Economy in Brief
Summary
In October, a 2.8% decline in U.S. sales of light vehicles to 16.16M units retraced most of the prior month's 3.5% increase, according to the Autodata Corporation. During the first ten months of 2006 vehicle sales averaged 16.58M [...]
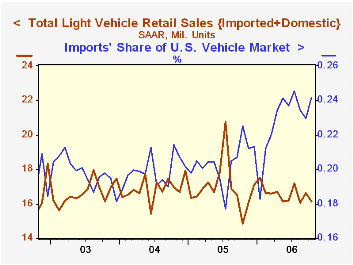
In October, a 2.8% decline in U.S. sales of light vehicles to 16.16M units retraced most of the prior month's 3.5% increase, according to the Autodata Corporation. During the first ten months of 2006 vehicle sales averaged 16.58M units, down 2.7% from the comparable period during 2005. Consensus estimates had been for 16.2M sales during October
Light truck sales fell 1.8% last month following a 7.5% September gain. That pulled the average of light truck sales year to date down 6.2% versus the first ten months of last year.
Sales of the relatively fuel efficient imported light trucks were again strong and rose 10.7% (38.5% y/y) after a 14.4% September jump. Year to date sales of imported light trucks are 12.4% higher than the first ten months of 2005. 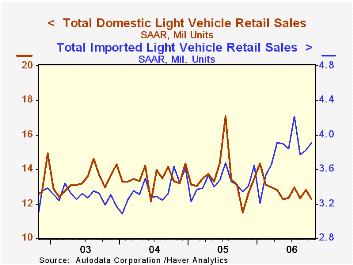
Domestic light truck sales fell 4.1% (+13.4% y/y) during October, the y/y comparison still favorable due to a slump last October after the end of a sales promotion. During the first ten months of this year domestic light truck sales fell 9.0% from the first ten months of 2005 to an average of 7.46M units (85% of the U.S. market).
Auto sales fell 4.0%, the third sequential m/m drop. Domestic car sales slumped 4.7% (-2.1% y/y) but year to date sales of U.S. nameplates were down a modest 1.3% versus 2005. Sales of imported autos also fell 2.6% (+6.0% y/y) and year to date sales of imported autos were up 8.9% versus 2005 and grabbed 31% of the U.S. car market. 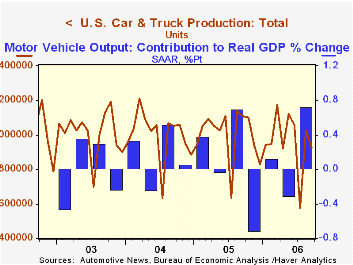
U.S. car & truck production, a figure in Haver's USECON database, fell 9.9% (-16.3% y/y) during October. Year to date production was off 5.2% from 2005. For all of last year production was about steady with 2004.
Economy on cruise control through 2007 from the Federal Reserve Bank of Chicago can be found here.
| Light Vehicle Sales (SAAR, Mil. Units) | October | September | Y/Y | 2005 | 2004 | 2003 |
|---|---|---|---|---|---|---|
| Total | 16.16 | 16.63 | 8.9% | 16.96 | 16.87 | 16.63 |
| Autos | 7.32 | 7.63 | 0.4% | 7.65 | 7.49 | 7.62 |
| Trucks | 8.84 | 9.00 | 17.2% | 9.32 | 9.37 | 9.01 |
by Tom Moeller November 2, 2006
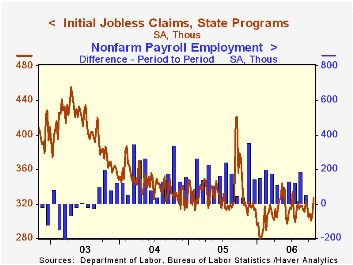
Initial claims for unemployment insurance jumped 18,000 last week to 327,000 from a little revised level during the prior period. Consensus expectations had been for 310,000 claims during the latest week.
There apparently were no special factors to explain the increase but it occurred after the period, which includes the twelfth of the month, when the nonfarm payrolls survey occurs. Therefore Consensus estimates of a 125,000 rise in October jobs, to be released tomorrow, should not change.
During the last ten years there has been a (negative) 78% correlation between the level of initial claims and the m/m change in nonfarm payroll employment.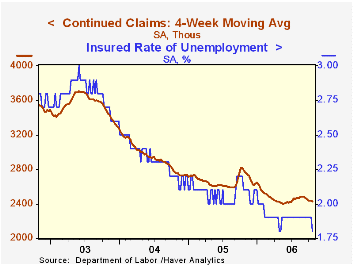
The four-week moving average of initial claims rose to 311,250 (-8.2% y/y).
Continuing claims for unemployment insurance fell 27,000 following a revised 4,000 decline the prior week that initially was reported as a slight increase.
The insured rate of unemployment revisited the six year low at 1.8% after being steady most of 2006 at 1.9%.
Are Two Employment Surveys Better than One? from the Federal Reserve Bank of St. Louis is available here.
| Unemployment Insurance (000s) | 10/28/06 | 10/21/06 | Y/Y | 2005 | 2004 | 2003 |
|---|---|---|---|---|---|---|
| Initial Claims | 327 | 309 | 1.6% | 332 | 343 | 403 |
| Continuing Claims | -- | 2,415 | -12.2% | 2,662 | 2,924 | 3,532 |
by Tom Moeller November 2, 2006
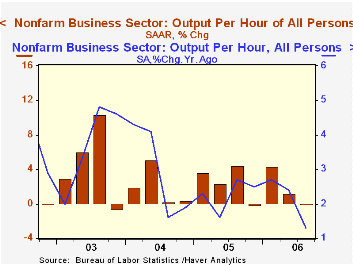
Non-farm labor productivity last quarter was unchanged from 2Q and the figure fell short of Consensus expectations for a 1.3% rise. While the q/q change was disappointing, similar weakness just last year was followed by recovery. This year, however, the y/y increase dropped to 1.3% as a result of the decline, the weakest since 1997.
The weakness fueled the growth in unit labor costs. A 3.8% gain lifted the y/y increase in costs to 5.3%, the strongest since 1990. During the last thirty years there has been an 85% correlation between labor cost growth the growth in the GDP chain price deflator, although that correlation has fallen sharply in recent years.
Compensation grew a much diminished 3.7, but here again the y/y growth remained elevated near 7%.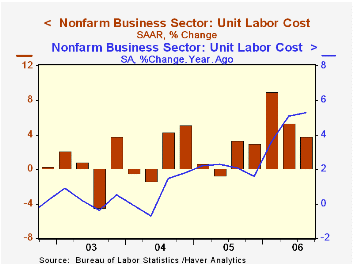
Factory sector productivity growth remained quite firm last quarter at 5.9% (4.3% y/y. Growth in factory sector compensation per hour slowed to 2.9% (5.1% y/y) from 4.0% during 2Q and 13.3% during 1Q and that fostered a decline in unit labor costs. The 2.9% (+0.8% y/y) decline was the first this year.
Freedom, Trade, and Growth from the Federal Reserve Bank of St. Louis can be found here
| Non-farm Business Sector (SAAR) | 3Q '06 | 2Q' 06 | Y/Y | 2005 | 2004 | 2003 |
|---|---|---|---|---|---|---|
| Output per Hour | 0.0% | 1.2% | 1.3% | 2.3% | 3.0% | 3.7% |
| Compensation per Hour | 3.7% | 6.6% | 6.7% | 4.4% | 3.6% | 4.0% |
| Unit Labor Costs | 3.8% | 5.4% | 5.3% | 2.0% | 0.6% | 0.3% |
by Tom Moeller November 2, 2006
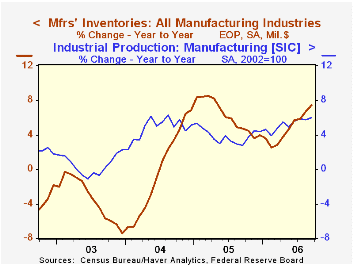
Factory inventories rose 0.6% last month. That matched the gain during July, which was upwardly revised, and it pulled the y/y change up to 7.4%, the fastest since early 2005.
Though petroleum inventories have fallen in recent months, higher prices have lifted the y/y gain to 15.7%. Despite this distortion, factory inventories less petroleum grew 7.0% y/y in September, the fastest since 2005.
Primary metals inventories rose another, firm 2.8% (16.3% y/y). Inventories of computers & electronic products actually fell slightly (9.3% y/y) after a strong 1.5% August increase and inventories of electrical equipment fell 0.3% (+11.6% y/y) after near 2% jumps during each of the prior three months. Machinery inventories spiked 1.4% (6.1% y/y).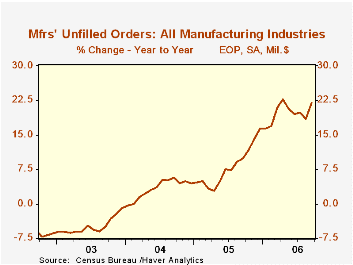
Total factory orders recovered a strong 2.1% after an August dip. That strength reflected an 8.3% pop in durable goods orders which was little revised from the advance report and reflected higher aircraft orders. Factory orders less transportation fell 2.4% (+3.0% y/y), the weakness reflecting a 4.6% decline in nondurables and a 14.8% drop in petroleum.
Factory shipments fell 3.5% due to the drop in petroleum. Transportation shipments also collapsed 4.5% due to a 7.3% drop in autos. Still, factory shipments less transportation & petroleum fell 2.0% (+5.0% y/y) due to across the board declines.
Unfilled orders surged 3.9% due to the jump in civilian aircraft. Less the transportation sector altogether backlogs rose 1.2% (13.1% y/y).
| Factory Survey (NAICS) | September | August | Y/Y | 2005 | 2004 | 2003 |
|---|---|---|---|---|---|---|
| Inventories | 0.6% | 0.6% | 7.4% | 4.0% | 6.9% | -7.4% |
| New Orders | 2.1% | -0.3% | 7.7% | 8.5% | 7.5% | 0.9% |
| Shipments | -3.5% | 0.8% | 2.4% | 7.1% | 6.8% | 0.2% |
| Unfilled Orders | 3.9% | 0.5% | 22.0% | 16.3% | 4.5% | -1.0% |
by Carol Stone November 2, 2006

German labor market data for September and October were reported today. We last checked in with these data at the end of June. The most notable factor then was an increase in job vacancies, and we wondered if they would translate into actual jobs. This may have happened -- at least to some extent.
Total employment in September was 39.17 million, up 24,000 from August and 334,000 or 0.9% from September 2005. It has risen for seven consecutive months (seasonally adjusted), and marks the longest such span since 1999/2000.
Moreover, the number of job vacancies has continued to rise. In October employers reported opportunities for 662,000 workers, and increase of 45,000 from September and 179,000 from a year ago. This increase in vacancies, when filled, would add about 0.5% to total employment.
The unemployment situation is mixed and depends on what measure one looks at. The harmonized "ILO" unemployment rate was 8.3% in September, steady with August, but up from a recent low of 7.9% in April. Germans prefer their own measure of "registered" unemployment rate, and it has declined, dipping to 10.4% in October, the lowest since April 2004. Among labor force groups, all sectors of the population have seen some year-on-year improvement in recent months (the individual categories are not seasonally adjusted, necessitating comparisons with like periods of prior years) and the rate for men in particular has reached down to 9.1%, the lowest since October 2001. Thus, job opportunities are increasing in Germany, and with a record number of vacancies shown in this report, that may yield more workers in the months ahead.
| Germany: Seas Adj, ex as noted | Oct 2006 | Sept 2006 | Aug 2006 | Year Ago | 2005 | 2004 | 2003 |
|---|---|---|---|---|---|---|---|
| LFS Employment (mil) | -- | 39.17 | 39.14 | 38.84 | 38.82 | 38.87 | 38.72 |
| Change (thous) | -- | +24 | +34 | +334 | -53 | +150 | -370 |
| Yr/Yr % Chg NSA | -- | -- | -- | +0.9 | -0.1 | +0.4 | -0.9 |
| Unemployment Rate (%, ILO Def.) | -- | 8.3 | 8.3 | 8.0 | 7.1 | 9.1 | 9.2 |
| Registered Unemployment Rate (%) | 10.4 | 10.6 | 10.6 | 11.6 | 11.7 | 10.6 | 10.5 |
| Job Vacancies (thous) | 662 | 617 | 589 | 483 | 488 | 278 | 318 |

Tom Moeller
AuthorMore in Author Profile »Prior to joining Haver Analytics in 2000, Mr. Moeller worked as the Economist at Chancellor Capital Management from 1985 to 1999. There, he developed comprehensive economic forecasts and interpreted economic data for equity and fixed income portfolio managers. Also at Chancellor, Mr. Moeller worked as an equity analyst and was responsible for researching and rating companies in the economically sensitive automobile and housing industries for investment in Chancellor’s equity portfolio. Prior to joining Chancellor, Mr. Moeller was an Economist at Citibank from 1979 to 1984. He also analyzed pricing behavior in the metals industry for the Council on Wage and Price Stability in Washington, D.C. In 1999, Mr. Moeller received the award for most accurate forecast from the Forecasters' Club of New York. From 1990 to 1992 he was President of the New York Association for Business Economists. Mr. Moeller earned an M.B.A. in Finance from Fordham University, where he graduated in 1987. He holds a Bachelor of Arts in Economics from George Washington University.
More Economy in Brief


