 Global| Nov 14 2012
U.S. Retail Sales Decline With Fewer Vehicle Purchases
by:Tom Moeller
|in:Economy in Brief
Summary
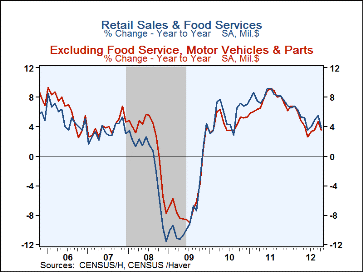
Total retail sales fell 0.3% last month following an upwardly revised 1.3% September rise, initially reported as 1.1%. A 0.1% downtick in October sales was expected according to Action Economics. Excluding autos, retail sales also [...]
The retail sales figure are available in Haver's USECON database. The Action Economics figures are in the AS1REPNA database.
| Retail Spending(%) | Oct | Sep | Aug | Oct Y/Y | 2011 | 2010 | 2009 |
|---|---|---|---|---|---|---|---|
| Total Retail Sales & Food Services | -0.3 | 1.3 | 1.0 | 3.8 | 8.0 | 5.5 | -7.1 |
| Excluding Autos | -0.0 | 1.2 | 0.8 | 3.6 | 7.4 | 4.5 | -5.7 |
| Retail Sales | -0.3 | 1.3 | 1.1 | 3.8 | 8.3 | 5.8 | -7.9 |
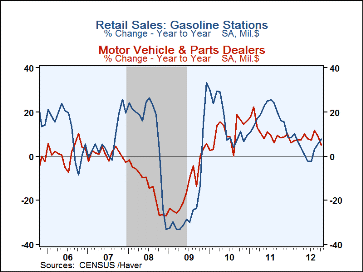
| Motor Vehicle & Parts | -1.5 | 1.7 | 1.8 | 5.0 | 10.9 | 10.8 | -13.9 |
| Retail excluding Autos | 0.0 | 1.2 | 1.0 | 3.5 | 7.6 | 4.7 | -6.4 |
| Gasoline Stations | 1.4 | 2.5 | 6.0 | 7.7 | 17.9 | 14.7 | -22.0 |
| Non-Auto Less Gasoline | -0.3 | 1.0 | 0.1 | 2.7 | 5.9 | 3.2 | -3.4 |
| Food Service | -0.4 | 0.8 | 0.0 | 4.2 | 5.9 | 3.2 | -0.9 |
U.S. PPI Backpedals With Lower Energy Prices
by Tom Moeller November 14, 2012
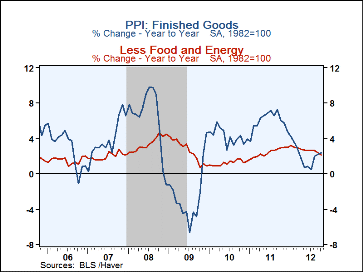
 The producer price index for finished goods fell 0.2% last
month. The decline followed four months of increase and contrasted with
expectations for a 0.2% rise. Excluding food & energy prices also fell
0.2% versus expectations for a 0.2% increase. Lower energy prices paced
last month's decline with a 0.5% (+3.1% y/y) drop. That reflected a 3.3%
(+2.7% y/y) decline in home heating oil costs and a 2.2% (+9.5% y/y)
easing in gasoline prices. Higher food prices offset these declines with a
0.4% (2.2% y/y) increase, the fifth consecutive month of gain.
The producer price index for finished goods fell 0.2% last
month. The decline followed four months of increase and contrasted with
expectations for a 0.2% rise. Excluding food & energy prices also fell
0.2% versus expectations for a 0.2% increase. Lower energy prices paced
last month's decline with a 0.5% (+3.1% y/y) drop. That reflected a 3.3%
(+2.7% y/y) decline in home heating oil costs and a 2.2% (+9.5% y/y)
easing in gasoline prices. Higher food prices offset these declines with a
0.4% (2.2% y/y) increase, the fifth consecutive month of gain.
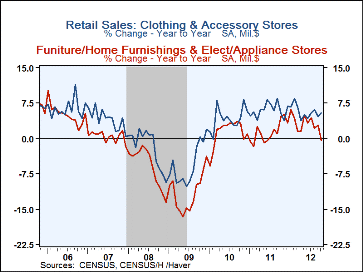
Finished consumer goods prices slipped 0.1% (+2.7% y/y). Excluding food & energy, consumer goods prices fell 0.3% (+2.6% y/y). Within the components, men's apparel prices rose 3.5% y/y while women's clothing costs increased 0.5% y/y. Household appliance prices gained 5.1% since October of 2011, furniture prices rose 2.2% y/y and passenger car prices increased 0.2% y/y. Capital equipment prices fell 0.3% last month (+1.4% y/y).
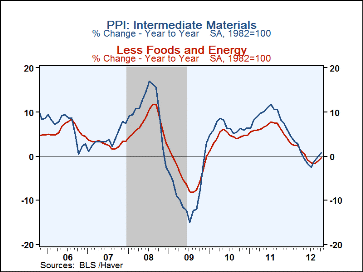
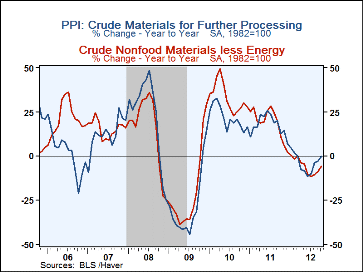
Intermediate goods prices slipped 0.1% (+0.8% y/y) as energy costs fell 0.6% (+2.3% y/y) following two months of strong increase. Food prices gained 0.7% (7.5% y/y) following three months of notable gain but energy prices slipped 0.6% (+2.3% y/y). Core-intermediate prices were unchanged (-0.5% y/y. Crude goods prices gained 0.9% (-0.0% y/y) last month bolstered by a 1.9% (9.2% y/y) jump in food prices and a 1.3% (-4.8% y/y) rise in energy prices. Prices excluding food & energy fell 1.4% (-5.9% y/y).
The PPI data are contained in Haver's USECON database with further detail in PPI and PPIR. The expectations figures are available in the AS1REPNA database.


| Producer Price Index (%) | Oct | Sep | Aug | Oct Y/Y | 2011 | 2010 | 2009 |
|---|---|---|---|---|---|---|---|
| Finished Goods | -0.2 | 1.1 | 1.7 | 2.3 | 6.0 | 4.2 | -2.5 |
| Less Food & Energy | -0.2 | 0.0 | 0.2 | 2.1 | 2.4 | 1.2 | 2.6 |
| Foods | 0.4 | 0.2 | 0.9 | 2.2 | 6.3 | 3.9 | -1.4 |
| Energy | -0.5 | 4.7 | 6.4 | 3.1 | 15.7 | 13.6 | -17.6 |
| Intermediate Goods | -0.1 | 1.5 | 1.1 | 0.8 | 9.1 | 6.4 | -8.4 |
| Less Food & Energy | 0.0 | 0.6 | -0.2 | -0.5 | 6.2 | 4.3 | -4.2 |
| Crude Goods | 0.9 | 2.8 | 5.8 | -0.0 | 17.4 | 21.4 | -30.3 |
| Less Food & Energy | -1.4 | 1.6 | 2.2 | -5.9 | 18.5 | 32.5 | -23.3 |
By Tom Moeller
Finished consumer goods prices slipped 0.1% (+2.7% y/y). Excluding food & energy, consumer goods prices fell 0.3% (+2.6% y/y). Within the components, men's apparel prices rose 3.5% y/y while women's clothing costs increased 0.5% y/y. Household appliance prices gained 5.1% since October of 2011, furniture prices rose 2.2% y/y and passenger car prices increased 0.2% y/y. Capital equipment prices fell 0.3% last month (+1.4% y/y).
Intermediate goods prices slipped 0.1% (+0.8% y/y) as energy costs fell 0.6% (+2.3% y/y) following two months of strong increase. Food prices gained 0.7% (7.5% y/y) following three months of notable gain but energy prices slipped 0.6% (+2.3% y/y). Core-intermediate prices were unchanged (-0.5% y/y. Crude goods prices gained 0.9% (-0.0% y/y) last month bolstered by a 1.9% (9.2% y/y) jump in food prices and a 1.3% (-4.8% y/y) rise in energy prices. Prices excluding food & energy fell 1.4% (-5.9% y/y).
The PPI data are contained in Haver's USECON database with further detail in PPI and PPIR. The expectations figures are available in the AS1REPNA database.
| Producer Price Index (%) | Oct | Sep | Aug | Oct Y/Y | 2011 | 2010 | 2009 |
|---|---|---|---|---|---|---|---|
| Finished Goods | -0.2 | 1.1 | 1.7 | 2.3 | 6.0 | 4.2 | -2.5 |
| Less Food & Energy | -0.2 | 0.0 | 0.2 | 2.1 | 2.4 | 1.2 | 2.6 |
| Foods | 0.4 | 0.2 | 0.9 | 2.2 | 6.3 | 3.9 | -1.4 |
| Energy | -0.5 | 4.7 | 6.4 | 3.1 | 15.7 | 13.6 | -17.6 |
| Intermediate Goods | -0.1 | 1.5 | 1.1 | 0.8 | 9.1 | 6.4 | -8.4 |
| Less Food & Energy | 0.0 | 0.6 | -0.2 | -0.5 | 6.2 | 4.3 | -4.2 |
| Crude Goods | 0.9 | 2.8 | 5.8 | -0.0 | 17.4 | 21.4 | -30.3 |
| Less Food & Energy | -1.4 | 1.6 | 2.2 | -5.9 | 18.5 | 32.5 | -23.3 |
By Tom Moeller
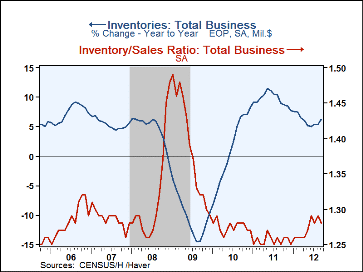
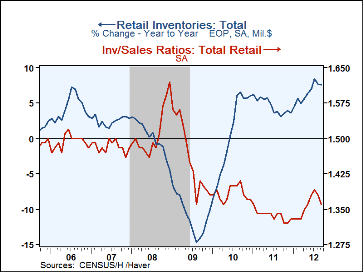
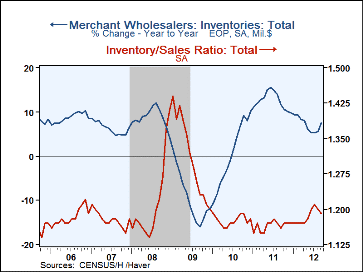
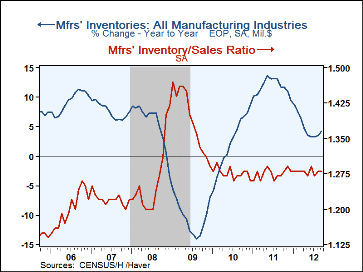
Business inventories rose 0.7% following a 0.6% August rise. Quickened accumulation during the last three months reflected the gains in merchant wholesalers inventories driven by a 5.5% surge (11.9% y/y) in petroleum inventories. Petroleum inventories also rose 10.2% in August. Elsewhere, wholesale inventories increased a firm 0.9% (7.2% y/y) during September. Inventories at the retail level gained a modest 0.3% (7.6% y/y). That was led by a 0.9% jump in autos (20.2% y/y) after a 1.2% August increase. Nonauto retail inventories were unchanged for the second consecutive month. Factory inventories rose a steady 0.6% (4.1% y/y).
Business sales jumped 1.4% led by an 8.3% (13.1% y/y) rise in wholesale sales. Wholesale sales increased 0.8% (2.8% y/y) without petroleum and the inventory-to-sales ratio remained a roughly constant 1.28. Retail sales surged 1.3% (5.4% y/y) as auto sales jumped. Excluding autos, sales increased 1.2% (4.5% y/y). As a result, the nonauto retail I/S ratio slipped to 1.18. Factory shipments gained 0.9% leaving the I/S ratio constant at 1.28.
The manufacturing and trade data are in Haver's USECON database.
| Business Inventories(%) | Sep | Aug | Jul | Sep Y/Y | 2011 | 2010 | 2009 |
|---|---|---|---|---|---|---|---|
| Total | 0.7 | 0.6 | 0.8 | 6.2 | 7.7 | 8.3 | -9.4 |
| Retail | 0.3 | 0.4 | 1.1 | 7.6 | 3.6 | 6.1 | -10.1 |
| Retail excl. Motor Vehicles | 0.0 | 0.0 | 0.4 | 2.8 | 3.7 | 3.9 | -4.8 |
| Merchant Wholesalers | 1.1 | 0.8 | 0.6 | 7.5 | 9.9 | 10.1 | -11.8 |
| Manufacturing | 0.6 | 0.6 | 0.6 | 4.1 | 9.4 | 8.8 | -6.8 |
| Business Sales (%) | |||||||
| Total | 1.4 | 0.6 | 0.9 | 4.4 | 11.3 | 9.7 | -14.8 |
| Retail | 1.3 | 1.1 | 0.8 | 5.4 | 8.3 | 5.8 | -7.9 |
| Retail excl. Motor Vehicles | 1.2 | 1.0 | 0.9 | 4.5 | 7.6 | 4.7 | -6.4 |
| Merchant Wholesalers | 2.0 | 1.0 | -0.2 | 4.4 | 13.5 | 11.6 | -16.2 |
| Manufacturing | 0.9 | -0.2 | 1.9 | 3.7 | 11.8 | 11.2 | -18.8 |
| I/S Ratio | |||||||
| Total | 1.28 | 1.29 | 1.28 | 1.25 | 1.26 | 1.27 | 1.39 |
| Retail | 1.36 | 1.38 | 1.39 | 1.34 | 1.34 | 1.38 | 1.46 |
| Retail Excl. Motor Vehicles | 1.18 | 1.20 | 1.21 | 1.20 | 1.21 | 1.24 | 1.30 |
| Merchant Wholesalers | 1.19 | 1.20 | 1.21 | 1.16 | 1.16 | 1.18 | 1.31 |
| Manufacturing | 1.28 | 1.28 | 1.27 | 1.27 | 1.27 | 1.28 | 1.39 |
By Tom Moeller
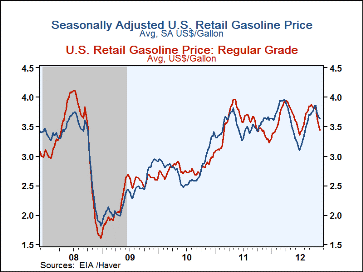
Gasoline prices are being helped lower by reduced seasonal pressure. Last week, the pump price for a gallon of regular gasoline fell another four cents (+0.4%) to $3.45 per gallon. Since their September peak prices have fallen 43 cents per gallon. Haver Analytics constructs seasonal factors to account for usual volatility and the adjusted price fell one penny w/w to $3.64 per gallon. Since their peak last month prices are down 22 cents per gallon.
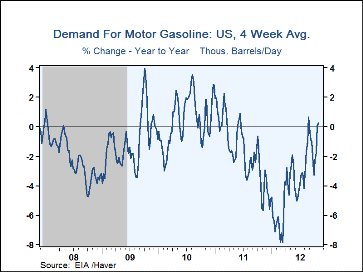
The demand for gasoline rose a minimal 0.2% y/y. Residual fuel oil needs, used for heating, fell 13.6% y/y and distillate demand dropped 15.3% y/y. Lending some support to prices was a minimal 0.9% y/y decline in gasoline inventories.
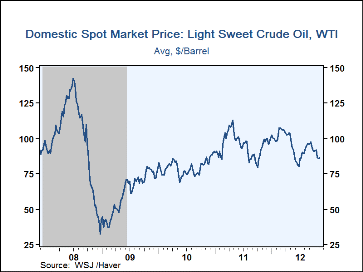
The price for a barrel of light sweet crude oil held roughly steady at $85.99 per barrel and yesterday slipped to $85.38. Brent crude oil prices inched up last week to $108.92 per barrel and were $109.08 yesterday.
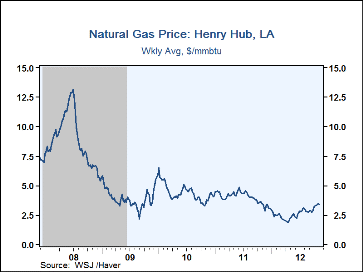
Natural gas prices fell last week to $3.39 per mmbtu but yesterday bounced upward to $3.58.
The energy price data are reported by the U.S. Department of Energy and can be found in Haver's WEEKLY database. The daily figures are in DAILY and the gasoline demand figures are in OILWKLY.
| Weekly Price | 11/12/12 | 11/05/12 | 10/29/12 | Y/Y% | 2011 | 2010 | 2009 |
|---|---|---|---|---|---|---|---|
| Retail Regular Gasoline ($ per Gallon, Regular) | 3.45 | 3.49 | 3.57 | 0.4 | 3.52 | 2.78 | 2.35 |
| Light Sweet Crude Oil, WTI ($ per bbl.) | 85.99 | 85.88 | 86.69 | -11.3 | 95.14 | 79.51 | 61.39 |
| Natural Gas ($/mmbtu) | 3.39 | 3.44 | 3.39 | -0.6 | 3.99 | 4.40 | 3.95 |
By Tom Moeller
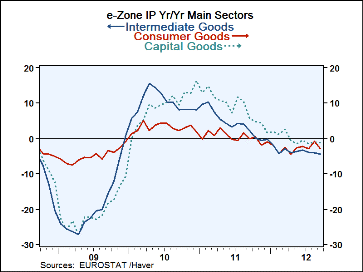
The drop is led by intermediate goods where output is falling a 6.4% annual rate over three-months and 4.5% over 12-months. Consumer goods output is falling at a 4.3% annual rate over three-months and 2.9% over 12-months. Capital goods production is still showing an increase over three-months, rising at a 0.8% annual rate but output in that sector is off by 1.2% yr/yr.
Among the original EMU members that have reported MFG IP data only the Netherlands has three straight months of output increases in July, August and Sept. Italy is the only other country with a net output increase over three months (a rise of 1% at an annual rate) with one monthly rise in output sandwiched between two monthly losses. France and Greece each have two months of IP increases in the last three but have deep enough declines in September to dominate the direction.
Germany is experiencing its sharpest 12-month weakens in IP in well over a year. Finland's Oct decline is the worst in nearly a year. Ireland and Portugal are seeing their worst drops in over a year as well. There is a new bout of severe weakness in force in the Zone. In addition some of the monthly declines in output are huge.
And while there has been a lot of ink spilled on how there is some agreement to extend terms for Greece, EMU can't exactly figure out how to do that just yet. Today across Europe there are anti-austerity protests playing out across the continent. Germany does not want to fund any more excess. But all these economies have been stopped in their tracks and are now imploding with dire consequences for their national fiscal positions. It may well be that disciplining some isolated banana republics for its economic excesses works and sets an example for others who will want to avoid that fate. But across a huge continent of highly developed countries this sort of policy is nothing more than economic madness: it's Austrian economics gone wild on steroids.
This is one of the reasons I am so sure that the e-Zone will break part. There is a lot of pro-euro rhetoric even from the one who holds the purse strings, Angela Merkel. But when push comes to shove no one wants to finance it so austerity becomes the answer... an answer that is no solution.
The one clear solution that is an answer is for countries to break out of the e-Zone and to gain control of their finances again by gaining control of their currencies. Of course it will mean a period of European inflation! But that's just another way of not paying your bills. This way is proving much more painful. It's much easier for a nation to stick its creditors with the bill than to force all that adjustment down the throats of its own people. That's what the protests are all about. Austerity? No! Not for ME, anyway!
The longer that EMU goes without a real solution and not just for Greece but for Spain and Portugal and Italy -and also not fixing what's off track in France- the bigger will be the problem. As we can see, giving Greece (little old Greece!) two more years costs money and no wants to pay for that! So how will the other countries problems be remedied? Not I said the little red hen. Not I said the IMF; not without a lot of assurances. Not I said Germany (or, not 'til after 2013!). So what is left?
It's very hard to be a true optimist on Europe these days without a good stash of either legal or illegal drugs. I'm guessing if you live in Washington State these days, in the wake of marijuana being legalized, Euro-optimism is a bit easier to come by. For the rest of us it's a stretch.
| E-zone MFG IP | ||||||||
|---|---|---|---|---|---|---|---|---|
| SAAR except M/M | M/M | Sep 12 | Sep 12 | Sep 12 | Aug 12 | |||
| Ezone Detail | Sep 12 | Aug 12 | Jul 12 | 3 Mo | 6 Mo | 12 Mo | 12 Mo | Q-3 Date |
| MFG | -2.6% | 0.9% | 0.9% | -3.6% | -4.5% | -3.0% | -2.1% | 2.1% |
| Consumer | -2.7% | 2.1% | -0.4% | -4.3% | -3.0% | -2.9% | -0.8% | 0.8% |
| C-Durables | -4.3% | 3.0% | -0.1% | -6.2% | -3.0% | -3.9% | -2.2% | |
| C-Non-Durables | -2.8% | 1.8% | -0.4% | -5.8% | -4.1% | -3.3% | -1.0% | |
| Intermediate | -2.0% | 0.2% | 0.2% | -6.4% | -5.3% | -4.5% | -4.1% | -2.1% |
| Capital | -3.1% | 1.3% | 2.0% | 0.8% | -4.9% | -1.2% | -1.0% | 6.8% |

Tom Moeller
AuthorMore in Author Profile »Prior to joining Haver Analytics in 2000, Mr. Moeller worked as the Economist at Chancellor Capital Management from 1985 to 1999. There, he developed comprehensive economic forecasts and interpreted economic data for equity and fixed income portfolio managers. Also at Chancellor, Mr. Moeller worked as an equity analyst and was responsible for researching and rating companies in the economically sensitive automobile and housing industries for investment in Chancellor’s equity portfolio. Prior to joining Chancellor, Mr. Moeller was an Economist at Citibank from 1979 to 1984. He also analyzed pricing behavior in the metals industry for the Council on Wage and Price Stability in Washington, D.C. In 1999, Mr. Moeller received the award for most accurate forecast from the Forecasters' Club of New York. From 1990 to 1992 he was President of the New York Association for Business Economists. Mr. Moeller earned an M.B.A. in Finance from Fordham University, where he graduated in 1987. He holds a Bachelor of Arts in Economics from George Washington University.
More Economy in Brief


