 Global| Jan 02 2008
U.S. Construction Spending Rose Slightly
by:Tom Moeller
|in:Economy in Brief
Summary
The value of construction put in lace rose a slight 0.1% during November following a 0.4% downtick during October. These, and other, small monthly changes this year have left the value of construction put in place down just 0.2% year [...]
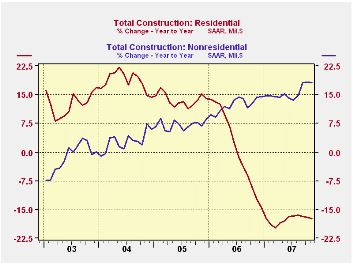
The value of construction put in lace rose a slight 0.1% during November following a 0.4% downtick during October. These, and other, small monthly changes this year have left the value of construction put in place down just 0.2% year to date.
Gains in nonresidential building activity have cushioned weakness in the residential area. Nonresidential building activity rose 2.1% in November and that pulled the year to date gain to 16.1%. Year to date, building in the lodging area is up a whopping 71.4%. Office construction is up 17.1% and commercial building rose 8.8%.
Residential building in November fell another 2.5% m/m and year to date activity is off 16.5%. Building of new single family units fell 5.0% during November. Year to date the decline totals 26.7%. Again to the upside was spending on improvements. It rose 0.7% in November and increased 3.9% ytd.
During the last twenty years there has been an 84% correlation between the q/q change in the value of residential building and its contribution to growth in real GDP.
Public construction spending also has been strong this year and rose 2.5% during November. That pulled to ytd gain to 12.5%. Construction on highways & streets rose 1.9%, 12.8% ytd. The value of construction on highways & streets is nearly one third of the value of total public construction spending. Construction spending on education also has been fir m and up 11.1% this year.
These more detailed categories represent the Census Bureau’s reclassification of construction activity into end-use groups. Finer detail is available for many of the categories; for instance, commercial construction is shown for Automotive sales and parking facilities, drugstores, building supply stores, and both commercial warehouses and mini-storage facilities. Note that start dates vary for some seasonally adjusted line items in 2000 and 2002 and that constant-dollar data are no longer computed.
| November | October | Y/Y | 2006 | 2005 | 2004 | |
|---|---|---|---|---|---|---|
| Total | 0.1% | -0.4% | -0.1% | 5.6% | 10.7% | 11.0% |
| Private | -0.7% | -0.9% | -4.8% | 4.7% | 12.0% | 13.8% |
| Residential | -2.5% | -2.3% | -17.8% | 0.5% | 13.7% | 18.7% |
| Nonresidential | 1.7% | 1.2% | 19.5% | 15.2% | 7.8% | 3.8% |
| Public | 2.5% | 0.9% | 16.2% | 9.2% | 6.2% | 1.7% |
by Tom Moeller January 2, 2008
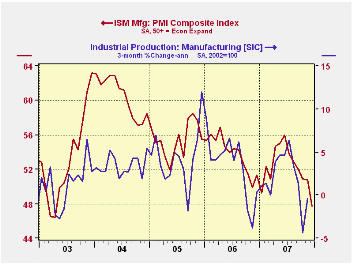
The Institute of Supply Management (ISM) reported that its Composite Index of Manufacturing Sector Activity fell in December to 47.7 from 50.8 in November. The decline contrasted with Consensus expectations for a slight m/m uptick to 51.0. Data points above 50 indicate growth in factory sector activity.
Last month's reading was the lowest since early 2003 and it was the first month below 50 since early last year.
During the last twenty years there has been a 64% correlation between the level of the Composite Index and the three month growth in factory sector industrial production.
It is appropriate to correlate the ISM index level with factory sector growth because the ISM index is a diffusion index. It measures growth by being constructed using all of the absolute positive changes in activity added to one half of the no change in activity measures.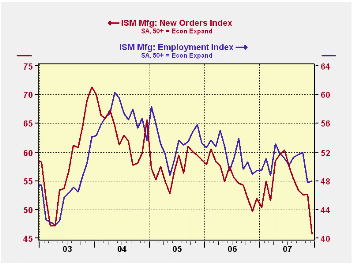
Sharp declines in the new orders and in the production components accounted for most of the decline in the composite index. The inventories index fell, but just slightly and the vendor deliveries index rose.
The index of new export orders fell out of bed with a six point m/m decline to its lowest level since last January. The index still, however, suggests that exports grew last month. The import index also remained low but nudged higher after great weakness last Fall. The index suggests declines in imports for the last three months.
The employment index recovered just slightly after a huge decline in November. That was its lowest level since 2003. During the last twenty years there has been a 67% correlation between the level of the ISM employment Index and the three month growth in factory sector employment.
The prices paid index again nudged higher to its highest level in six months. During the last twenty years there has been a 77% correlation between the price index and the three month change in the PPI for intermediate goods.
| December | November | December '06 | 2007 | 2006 | 2005 | |
|---|---|---|---|---|---|---|
| Composite Index | 47.7 | 50.8 | 51.4 | 52.2 | 53.9 | 55.5 |
| New Orders Index | 45.7 | 52.6 | 51.9 | 54.4 | 55.4 | 57.4 |
| Prices Paid Index (NSA) | 68.0 | 67.5 | 47.5 | 64.6 | 65.0 | 66.4 |
by Tom Moeller January 2, 2008
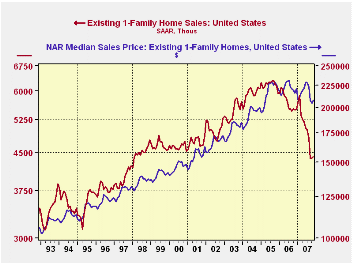
According to the National Association of Realtors, sales of existing homes ticked 0.4% higher during November. The rise, however, did little to recover declines during the prior eight months which totaled 25.4% Moreover, sales remained nearly one third lower than at the peak in late 2005
Sales of single family homes led November's rise with a 0.7% gain which was the first m/m gain since February. Sales in the West jumped 10.1% (-25.6% y/y) but that was the only region to post a gain. Sales in the Midwest fell 0.9% m/m (-16.7% y/y). Single family home sales in the Northeast fell 3.0% (-19.0% y/y) and sales in the South fell 1.1% (-18.9% y/y).
The median price of an existing single family home rose 1.9% (-3.7% y/y) and recouped all of the prior month's decline.
Perspectives on Housing and the Economic Outlook from the Federal Reserve Bank of Kansas City can be found here.
| Existing Single Family Home Sales |
November | y/y % | October | November '06 | 2006 | 2005 | 2004 |
|---|---|---|---|---|---|---|---|
| Total | 5,000 | -20.0 | 4,980 | 6,250 | 6,510 | 7,075 | 6,727 |
| Northeast | 870 | -19.4 | 1,080 | 1,030 | 1,088 | 1,169 | 1,113 |
| Midwest | 1,180 | -16.9 | 1,180 | 1,420 | 1,492 | 1,588 | 1,550 |
| South | 1,990 | -19.4 | 2,030 | 2,470 | 2,578 | 2,704 | 2,540 |
| West | 960 | -25.0 | 870 | 1,2800 | 1,353 | 1,616 | 1,575 |
| Single-Family | 4,400 | -19.9 | 4,370 | 5,490 | 5,677 | 6,182 | 5,958 |
| Median Price, Total, $ | 210,200 | -3.3 | 206,9000 | 217,300 | 222,000 | 218,217 | 193,233 |
by Tom Moeller January 2, 2008
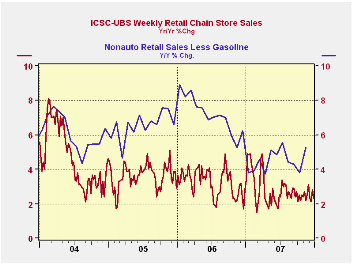
The ICSC-UBS retail chain-store sales index is constructed using the same-store sales (stores open for one year) reported by 78 stores of seven retailers: Dayton Hudson, Federated, Kmart, May, J.C. Penney, Sears and Wal-Mart.
Working the other way, the leading indicator of chain store sales from ICSC-UBS fell for the second week and was down for all of December for the third month in the last four.Housing, credit and consumer expenditure from the Federal Reserve Bank of Kansas City can be found here.
| ICSC-UBS (SA, 1977=100) | 12/29/07 | 12/22/07 | Y/Y | 2006 | 2005 | 2004 |
|---|---|---|---|---|---|---|
| Total Weekly Chain Store Sales | 487.7 | 488.8 | 2.3% | 3.3% | 3.6% | 4.7% |

Tom Moeller
AuthorMore in Author Profile »Prior to joining Haver Analytics in 2000, Mr. Moeller worked as the Economist at Chancellor Capital Management from 1985 to 1999. There, he developed comprehensive economic forecasts and interpreted economic data for equity and fixed income portfolio managers. Also at Chancellor, Mr. Moeller worked as an equity analyst and was responsible for researching and rating companies in the economically sensitive automobile and housing industries for investment in Chancellor’s equity portfolio. Prior to joining Chancellor, Mr. Moeller was an Economist at Citibank from 1979 to 1984. He also analyzed pricing behavior in the metals industry for the Council on Wage and Price Stability in Washington, D.C. In 1999, Mr. Moeller received the award for most accurate forecast from the Forecasters' Club of New York. From 1990 to 1992 he was President of the New York Association for Business Economists. Mr. Moeller earned an M.B.A. in Finance from Fordham University, where he graduated in 1987. He holds a Bachelor of Arts in Economics from George Washington University.
More Economy in Brief


