 Global| Feb 27 2006
New One-Family Home Sales Decline: Inventories Rise
Summary
Sales of new one-family houses were reported by the Census Bureau and Department of Housing and Urban Development at a seasonally adjusted annual rate of 1.233 million in January. Sales were 5.0% below the December level and were at [...]
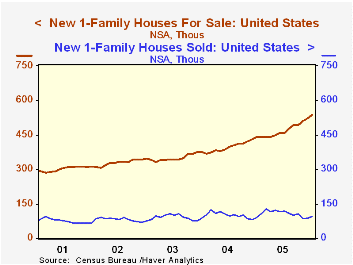
Sales of new one-family houses were reported by the Census Bureau and Department of Housing and Urban Development at a seasonally adjusted annual rate of 1.233 million in January. Sales were 5.0% below the December level and were at the lowest level since January, 2005. As a result of the decline in sales the inventory of unsold houses continued to rise. On a seasonally adjusted basis, the number of new houses for sale stood at 528,000 in January, up 2.5% from December and a 20.8% over January of a year ago.
The widening gap between the stock of one-family houses for sale and their sales is shown in the first chart. Because the seasonally adjusted data are shown on an annual rate basis for the sales and a monthly basis for the inventory data, the chart is based on the seasonally unadjusted data which are both shown in monthly terms.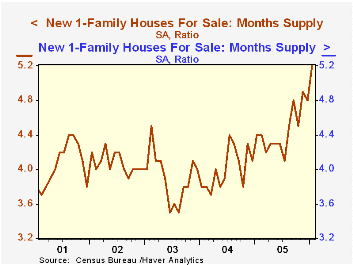
Another way of looking at the inventory situation is to note the number of months the existing stock could supply at the current rate of sales. This measure has risen sharply since mid 2005 as shown in the second chart.
In geographic terms sales in the North East, the Midwest and the South all were down 10% or more while, sales in the West rose more than 10%. Increases in inventory were most marked in the North East and the South where year-over-year increases in one-family houses for sale were 56% and 32%, respectively. The number of houses for sale actually declined over the year in the Midwest and were up 17% in the West.
| Bureau of the Census Dept of Housing and Urban Development | Jan 06 | Dec 05 | Jan 05 | M/M % | Y/Y % | 2005 | 2004 | 2003 |
|---|---|---|---|---|---|---|---|---|
| New Home Sales (SAAR) (000) | 1233 | 1298 | 1194 | -5.0 | 3.3 | 1283 | 1200 | 1091 |
| North East | 57 | 67 | 61 | -14.9 | -6.6 | 81 | 82 | 80 |
| Midwest | 199 | 223 | 186 | -10.8 | 7.0 | 206 | 211 | 189 |
| South | 602 | 671 | 616 | -10.3 | -2.3 | 639 | 561 | 513 |
| West | 375 | 337 | 331 | 11.3 | 13.3 | 357 | 347 | 308 |
| Homes for Sale NAS (000) | 536 | 521 | 441 | 2.9 | 21.5 | 521 | 431 | 377 |
| North East | 50 | 47 | 32 | 6.4 | 56.3 | 47 | 30 | 29 |
| Midwest | 109 | 109 | 112 | 0.0 | -2.7 | 108 | 102 | 84 |
| South | 269 | 256 | 204 | 5.1 | 31.9 | 256 | 200 | 172 |
| West | 108 | 109 | 92 | -0.9 | 17.4 | 109 | 91 | 79 |
More Economy in Brief


