 Global| Nov 03 2008
ISM Index Lowest Since 1982 Recession
by:Tom Moeller
|in:Economy in Brief
Summary
The Composite Index of Manufacturing Sector Activity, reported by the Institute for Supply Management (ISM), fell during October to its lowest level since the end of the 1981-82 recession. The 4.6 point m/m decline to a level of 38.9 [...]
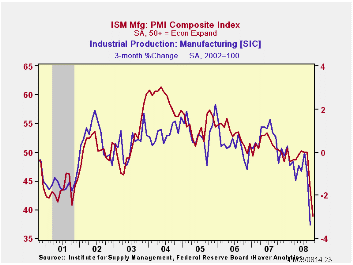
The Composite Index of Manufacturing Sector Activity, reported by the Institute for Supply Management (ISM), fell during October to its lowest level since the end of the 1981-82 recession. The 4.6 point m/m decline to a level of 38.9 exceeded Consensus expectations for a decline to 41.5. The break-even level for this measure of factory sector activity is 50.
During the last twenty years there has been a 64% correlation between the level of the Composite Index and the three-month growth in factory sector industrial production.
It is appropriate to correlate the ISM index level with factory sector growth because the ISM index is a diffusion index. It measures growth by using all of the positive changes in activity added to one half of the zero change in activity measures.
During the last two months, the ISM index composite index fell by eleven points. A decline of that degree was exceeded only by the drop during the short "credit crunch" recession of 1980. Following that decline, the index bounced back smartly only then to fall again during the sharp recession of 1981-82. How severe was that economic downturn? During all of 1982 the average level of the ISM (then called the Nat'l Association of Purchasing Management) index was 38.5 versus an average 52.5 during 1979. The index level signaled a 5.4% decline in factory sector industrial production during 1982 as reported by the Federal Reserve Board.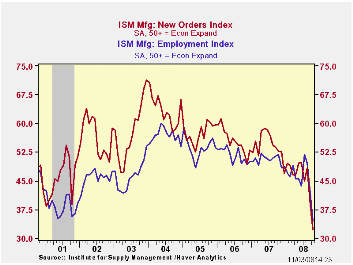
The new orders index during November fell a sharp 6.6 points to 32.2. The decline followed a 9.5 point plunge during September and it was to the lowest level since 1981. Economic weakness outside of the U.S. was signaled by the new export orders sub-series. It fell eleven points to a less than break-even level of 41.0, its lowest level in this index's short twenty year history. During the last ten years there has been a 53% correlation between the index and the q/q change in real exports of goods in the GDP accounts.
The production sub-series fell another 6.7 points, to 34.1, after the sharp 11.3 point decline during September. This weakness was mirrored by a decline in the employment index which repeated its September performance and fell 7.2 points to 34.6, the lowest reading since early 1991. During the last twenty years there has been a 67% correlation between the level of the ISM employment index and the three-month growth in factory sector employment.
The shedding of inventories continued at its recent rate as indicated by a an index level of 44.3 which was up just slightly from September. The index gauging the speed of supplier deliveries fell, but just moderately, and order backlogs declined to their lowest level in the series' history.
Prices paid plunged another 16.5 points to 37.0, the lowest level since late 2001 and that further reflected the decline in oil prices. During the last twenty years there has been a 79% correlation between the price index and the three-month change in the PPI for intermediate goods.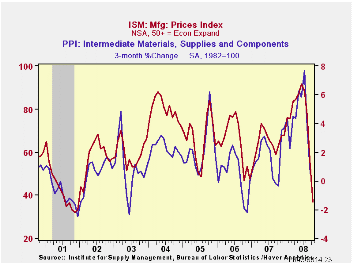
According to the National Association of Business Economists, 90% of the 102 members responding were more pessimistic about the economy than they were in July. A recession was viewed likely to continue at least through the end of next year, with 79% saying the economy will grow less than 1% and 38% saying the economy will shrink next year.
The Future of Mortgage Finance in the United States is Friday's speech by Fed Chairman Ben S. Bernanke and it can be found here.
| ISM Mfg | October | September | October '07 | 2007 | 2006 | 2005 |
|---|---|---|---|---|---|---|
| Composite Index | 38.9 | 43.5 | 50.4 | 51.1 | 53.1 | 54.4 |
| New Orders Index | 32.2 | 38.8 | 52.8 | 54.3 | 55.4 | 57.4 |
| Employment Index | 34.6 | 41.8 | 51.8 | 50.5 | 51.7 | 53.6 |
| Prices Paid Index (NSA) | 37.0 | 53.5 | 63.0 | 64.6 | 65.0 | 66.4 |

Tom Moeller
AuthorMore in Author Profile »Prior to joining Haver Analytics in 2000, Mr. Moeller worked as the Economist at Chancellor Capital Management from 1985 to 1999. There, he developed comprehensive economic forecasts and interpreted economic data for equity and fixed income portfolio managers. Also at Chancellor, Mr. Moeller worked as an equity analyst and was responsible for researching and rating companies in the economically sensitive automobile and housing industries for investment in Chancellor’s equity portfolio. Prior to joining Chancellor, Mr. Moeller was an Economist at Citibank from 1979 to 1984. He also analyzed pricing behavior in the metals industry for the Council on Wage and Price Stability in Washington, D.C. In 1999, Mr. Moeller received the award for most accurate forecast from the Forecasters' Club of New York. From 1990 to 1992 he was President of the New York Association for Business Economists. Mr. Moeller earned an M.B.A. in Finance from Fordham University, where he graduated in 1987. He holds a Bachelor of Arts in Economics from George Washington University.
More Economy in Brief


