 Global| Nov 03 2008
ISM Index Lowest Since 1982 Recession
by:Tom Moeller
|in:Economy in Brief
Summary
The Composite Index of Manufacturing Sector Activity, reported by the Institute for Supply Management (ISM), fell during October to its lowest level since the end of the 1981-82 recession. The 4.6 point m/m decline to a level of 38.9 [...]
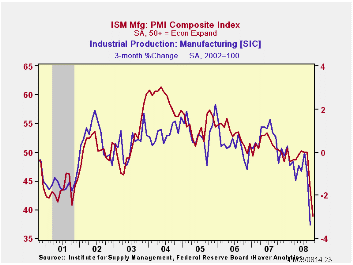
The Composite Index of Manufacturing Sector Activity, reported by the Institute for Supply Management (ISM), fell during October to its lowest level since the end of the 1981-82 recession. The 4.6 point m/m decline to a level of 38.9 exceeded Consensus expectations for a decline to 41.5. The break-even level for this measure of factory sector activity is 50.
During the last twenty years there has been a 64% correlation between the level of the Composite Index and the three-month growth in factory sector industrial production.
It is appropriate to correlate the ISM index level with factory sector growth because the ISM index is a diffusion index. It measures growth by using all of the positive changes in activity added to one half of the zero change in activity measures.
During the last two months, the ISM index composite index fell
by eleven points. A decline of that degree was exceeded only by the
drop during the short "credit crunch" recession of 1980. Following that
decline, the index bounced back smartly only then to fall again during
the sharp recession of 1981-82. How severe was that economic downturn?
During all of 1982 the average level of the ISM (then called the Nat'l
Association of Purchasing Management) index was 38.5 versus an average
52.5 during 1979. The index level signaled a 5.4% decline in factory
sector industrial production during 1982 as reported by the Federal
Reserve Board.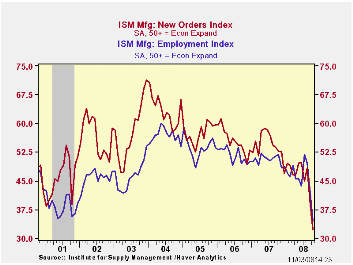
The new orders index during November fell a sharp 6.6 points to 32.2. The decline followed a 9.5 point plunge during September and it was to the lowest level since 1981. Economic weakness outside of the U.S. was signaled by the new export orders sub-series. It fell eleven points to a less than break-even level of 41.0, its lowest level in this index's short twenty year history. During the last ten years there has been a 53% correlation between the index and the q/q change in real exports of goods in the GDP accounts.
The production sub-series fell another 6.7 points, to 34.1, after the sharp 11.3 point decline during September. This weakness was mirrored by a decline in the employment index which repeated its September performance and fell 7.2 points to 34.6, the lowest reading since early 1991. During the last twenty years there has been a 67% correlation between the level of the ISM employment index and the three-month growth in factory sector employment.
The shedding of inventories continued at its recent rate as indicated by a an index level of 44.3 which was up just slightly from September. The index gauging the speed of supplier deliveries fell, but just moderately, and order backlogs declined to their lowest level in the series' history.
Prices paid plunged another 16.5 points to 37.0, the lowest
level since late 2001 and that further reflected the decline in oil
prices. During the last twenty years there has been a 79% correlation
between the price index and the three-month change in the PPI for
intermediate goods.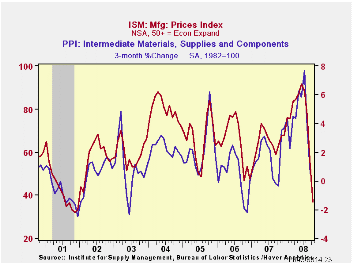
According to the National Association of Business Economists, 90% of the 102 members responding were more pessimistic about the economy than they were in July. A recession was viewed likely to continue at least through the end of next year, with 79% saying the economy will grow less than 1% and 38% saying the economy will shrink next year.
The Future of Mortgage Finance in the United States is Friday's speech by Fed Chairman Ben S. Bernanke and it can be found here.
| ISM Mfg | October | September | October '07 | 2007 | 2006 | 2005 |
|---|---|---|---|---|---|---|
| Composite Index | 38.9 | 43.5 | 50.4 | 51.1 | 53.1 | 54.4 |
| New Orders Index | 32.2 | 38.8 | 52.8 | 54.3 | 55.4 | 57.4 |
| Employment Index | 34.6 | 41.8 | 51.8 | 50.5 | 51.7 | 53.6 |
| Prices Paid Index (NSA) | 37.0 | 53.5 | 63.0 | 64.6 | 65.0 | 66.4 |
by Tom Moeller November 3, 2008
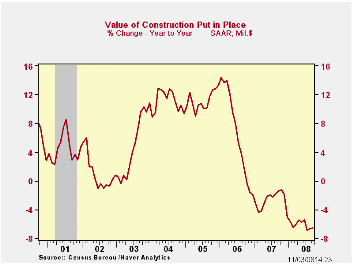
The value of construction put in place fell 0.3% during September. That reversed an August rise which was revised up slightly and the September decline was less than expectations for a 0.8% drop.Year-to-year, the decline in construction activity remained steady at a -6.6% pace.
A drop in the value of residential building activity led the September decline in overall construction. The 1.3% m/m fall reversed most an August increase and it was led by a 4.7% (-41.3% y/y) drop in single-family construction, off by two-thirds from its peak in early-2006. Building activity on multi-family units reversed nearly half of the August decline with a 2.7% (-1.7% y/y) rise while spending on improvements added to an August increase, up 2.4% m/m (-6.6% y/y).
During the last twenty years there has been an 84% correlation
between the q/q change in the value of residential building and its
contribution to growth in real GDP.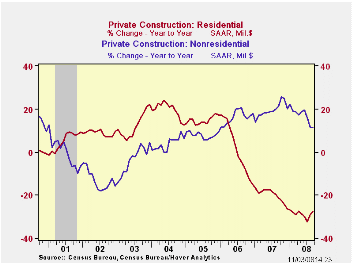
The value of nonresidential building activity recovered 1.2% after an August decline. A 4.4% (5.7% y/y) rise in the educational category led the increase while airport building rose by nearly one-half. Increases here were offset by a 2.3% (-11.3% y/y) decline in the multi-retail category. Spending on health care facilities inched up 0.1% (4.5% y/y) while office construction increased 1.7% (7.4% y/y).
Public construction reversed its August gain with a 1.3% decline. The value of construction spending on highways & streets led the weakness with a 1.5% drop (+1.7% y/y). The value of construction on highways & streets is roughly one-third of the value of total public construction spending. Building activity of office space continued firm and rose 1.6% (34.4% y/y) but spending on health care facilities fell 3.5% (+4.0% y/y).
The more detailed categories of construction represent the Census Bureau’s reclassification of construction activity into end-use groups. Finer detail is available for many of the categories; for instance, commercial construction is shown for automotive sales and parking facilities, drugstores, building supply stores, and both commercial warehouses and mini-storage facilities. Note that start dates vary for some seasonally adjusted line items in 2000 and 2002 and that constant-dollar data are no longer computed.
| Construction (%) | September | August | Y/Y | 2007 | 2006 | 2005 |
|---|---|---|---|---|---|---|
| Total | -0.3 | 0.3 | -6.6 | -2.7 | 6.3 | 11.2 |
| Private | 0.1 | -0.1 | -10.3 | -6.9 | 5.5 | 12.7 |
| Residential | -1.3 | 1.9 | -27.7 | -19.8 | 1.0 | 14.9 |
| Nonresidential | 1.2 | -1.6 | 11.4 | 19.6 | 16.2 | 7.8 |
| Public | -1.3 | 1.3 | 3.8 | 12.3 | 9.3 | 6.2 |
by Robert Brusca November 3, 2008
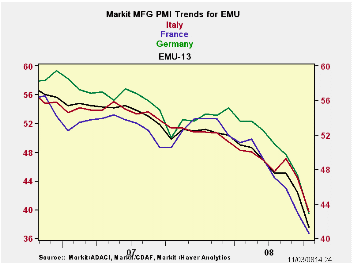
The e-Zone economy shrank by 0.2% in 2008-Q2 and further weakness lies ahead according to the EU Commission. The EU Commission issued a statement warning that “In 2009, the EU economy is expected to grind to a standstill.’ The Commission forecasts tiny GDP declines for the Zone in Q4 2008 and in Q1 of 2009.
But the Markit PMI’s today seem to hint at the potential for deeper declines. MFG tends to be one of the more volatile sectors in recession so these PMIs, taken alone, overstate the case. The service sector holds up better and service sector employment typically holds up much better in recession in comparison to MFG. But both the Services and the MFG PMIs for Europe have been weak. The e-Zone has not experienced a recession since its formation. But as of September the EMU services PMI was in the bottom 12% of its range and now the MFG sector in EMU is the worst ever.
Sneezing in Frankfurt - Some might view the lack of recession since the region’s formation as an asset for the region, but to me, it’s another sign: it points out how poorly interconnected the various countries still are in EMU. It is not a sign of greater resilience - far form it. Europe’s economy is much less flexible than the US economy. One view is that a diversified area has been put together and since we add up GDP across the whole region it has become more stable than its individual parts. But that is a portfolio theory argument and the parts can only do this if they are not highly mutually correlated or less that fully integrated. So the lack of commonality proves the point of poor integration. Until someone can sneeze in Frankfurt and give someone a cold in Paris, Europe is fragmented.
The US is a much larger geographic and economic region and it is so connected that the region – even with its differences - experiences recessions. The resilience of EMU is yet another manifestation of how the region is not yet fully integrated. Workers within Europe are NOT indifferent as to whether they work in London, in Frankfurt or in Paris, or more broadly, the UK, Germany or France. Language and culture still separate European nations. Yet the downturn this time has such common themes that it is dragging even the disparate EMU into recession. That’s testament to the strength of the negative forces this time around.
Some Structural differences Persist: Not surprisingly, for Germany, France, Italy, Spain, Ireland and the UK, the average country level correlation with OVERALL EMU MFG is 0.86. For SERVICES it is a lower 0.82. Only in the UK and Ireland is the service sector better correlated with the EMU–wide measure than is the MFG index with its Europe-wide measure. That is probably due to the UK’s separate use of the pound in lieu of the euro and the faster impact on MFG flows than on services that FX rates exhibit. In the case of Ireland, the fact that Ireland is geographically more plugged into the UK economy and its cycles drives the rogue result. So it is basically the similarity in MFG that binds Europe together while Services differences largely persist across regions and tend to isolate euro-regions. This is in keeping with the way competition has been meted out within Europe and with the obviously more competitive nature of MFG with MFG anywhere – at least in comparison with services. Even with wide open competition in services, some services simply are local, like table service by a waiter at a restaurant, plumbing and electrician services on site and dry cleaning. Still, we know that some services that seem to be ‘intrinsically local’ have found ways to break down borders (ie video rentals delivered either over the internet or by mail instead of via the neighborhood store).
We will have to wait and see if the recession in Europe turns out to be as benign as the EU commission forecast suggests. The German finance ministry continues to tell how much better prepared Germany is to take this recession than other countries. Time will tell. I remain a Euro-skeptic.
| NTC MFG Indices | |||||||
|---|---|---|---|---|---|---|---|
| Oct-08 | Sep-08 | Aug-08 | 3Mo | 6Mo | 12Mo | Percentile | |
| Euro-13 | 41.10 | 44.97 | 47.55 | 44.54 | 46.79 | 49.50 | 0.0% |
| Germany | 42.88 | 47.36 | 49.68 | 46.64 | 49.49 | 51.81 | 4.6% |
| France | 40.59 | 42.97 | 45.79 | 43.12 | 46.19 | 49.52 | 0.0% |
| Italy | 39.67 | 44.42 | 47.07 | 43.72 | 45.24 | 47.72 | 0.0% |
| Spain | 34.60 | 38.32 | 42.40 | 38.44 | 39.82 | 43.94 | 0.0% |
| Austria | 43.44 | 46.01 | 48.61 | 46.02 | 47.20 | 50.09 | 0.7% |
| Greece | 48.14 | 50.81 | 52.46 | 50.47 | 51.77 | 52.37 | 5.3% |
| Ireland | 39.69 | 43.70 | 44.88 | 42.76 | 43.60 | 45.86 | 0.0% |
| Netherlands | 45.28 | 48.30 | 49.82 | 47.80 | 48.99 | 51.03 | 16.2% |
| EU | |||||||
| UK | 41.49 | 41.15 | 45.28 | 42.64 | 44.51 | 48.05 | 2.2% |
| Percentile is over range since March 2000 | |||||||
by Louise Curley November 3, 2008

With recession on the horizon, questions have arisen as to how deep, how widespread and how long it will be. Forecasts of Gross Domestic Product for a number of countries, which may help in answering some of these questions, can be found in various Haver databases.
For the United States, Macroeconomic Advisors provides
short-term quarterly and long-term annual forecasts of GDP that are
updated quarterly. The most recent forecast covers the period from the
third quarter of 2008 to the fourth quarter of 2010 and was updated on
October 24. Oxford Economics provides quarterly and annual forecasts
for ten years into the future for most countries. Their latest
forecasts were issued October 16. The first chart shows the Oxford
Economics annual forecasts for India and China and the second shows
forecasts for Germany, Japan and the United States.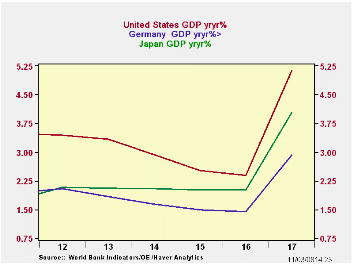
Eurostat publishes an annual series of GDP for all European Union countries as well as Croatia, Macedonia, Turkey, Norway and Switzerland. The last two years published are forecasts. For example, currently data are given for 2008 and 2009, both of which are forecasts. The latest data for these series were published on October 8. The OECD Outlook also publishes forecasts. These, however, are released only twice a year, in June and December. Sometimes the forecasts are outdated by subsequent events as at present.
| OXFORD ECONOMIC FORECASTS | 2007 | 2008 | 2009 | 2010 |
|---|---|---|---|---|
| France | 2.11 | 0.85 | 0.11 | 1.63 |
| Germany | 2.39 | 1.47 | 0.16 | 1.47 |
| Italy | 1.36 | -0.11 | -018 | 0.91 |
| United States | 2.01 | 1.46 | 0.41 | 2.73 |
| Japan | 2.01 | 0.70 | -0.10 | 1.10 |
| China | 11.87 | 10.03 | 8.25 | 8.00 |
| India | 9.34 | 7.80 | 6.23 | 7.56 |
| EUROSTAT FORECASTS | ||||
| France | -- | 1.58 | 1.37 | -- |
| Germany | -- | 1.85 | 1.54 | -- |
| Italy | -- | 0.54 | 0.76 | -- |

Tom Moeller
AuthorMore in Author Profile »Prior to joining Haver Analytics in 2000, Mr. Moeller worked as the Economist at Chancellor Capital Management from 1985 to 1999. There, he developed comprehensive economic forecasts and interpreted economic data for equity and fixed income portfolio managers. Also at Chancellor, Mr. Moeller worked as an equity analyst and was responsible for researching and rating companies in the economically sensitive automobile and housing industries for investment in Chancellor’s equity portfolio. Prior to joining Chancellor, Mr. Moeller was an Economist at Citibank from 1979 to 1984. He also analyzed pricing behavior in the metals industry for the Council on Wage and Price Stability in Washington, D.C. In 1999, Mr. Moeller received the award for most accurate forecast from the Forecasters' Club of New York. From 1990 to 1992 he was President of the New York Association for Business Economists. Mr. Moeller earned an M.B.A. in Finance from Fordham University, where he graduated in 1987. He holds a Bachelor of Arts in Economics from George Washington University.
More Economy in Brief


