 Global| Mar 07 2005
Commodity Prices Broadly Higher
by:Tom Moeller
|in:Economy in Brief
Summary
The JoC-ECRI (Journal of Commerce-Economic Cycle Research Institute) index of industrial commodity prices surged in three out of the last four weeks. The gains lifted the latest reading 2.7% above the February average though the y/y [...]
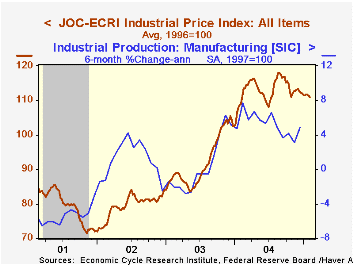
The JoC-ECRI (Journal of Commerce-Economic Cycle Research Institute) index of industrial commodity prices surged in three out of the last four weeks. The gains lifted the latest reading 2.7% above the February average though the y/y gain was a low 1.2% due to pricing strength this time, last year.
During the last ten years there has been a 45% correlation between the JoC-ECRI commodity price index and the six month change in factory sector industrial production.
Petroleum prices were up 8.9% last week versus February as a 10.4% rise in crude oil prices to $52.70 bolstered a 3.0% (43.8% y/y) increase in the price of benzene.
Textile prices finally showed some lift and were 2.7% higher versus February led by a 9.7% jump in the price of cotton (-29.5% y/y). Lumber prices also rose a strong 4.4% (9.8% y/y) and prices for lengths of structural composite jumped 6.6% (-21.3% y/y).
Metals prices rose 1.8% in the latest week versus February. Higher aluminum prices led the strength with a 3.1% rise versus last month (15.0% y/y) and zinc prices also surged 3.8% (20.3% y/y).
The KR-CRB (Knight Ridder-Commodity Research Bureau) commodity price index also rose the first of March by 1.6% versus February and it rose further during last week. The index differs from the JoC-ECRI version in that roughly half of the weighting reflects agricultural prices. The latest gains reflect higher prices for foodstuffs (-11.6% y/y) which have offset lower livestock prices (-5.7% y/y).
| JoC-ECRI Industrial Price Index | 03/04/05 | 12/31/04 | Y/Y | 2004 | 2003 | 2002 |
|---|---|---|---|---|---|---|
| All Items | 116.00 | 111.60 | 1.2% | 112.78 | 91.97 | 79.53 |
| Textiles | 67.00 | 64.40 | -3.0% | 65.83 | 65.09 | 59.73 |
| Metals | 125.60 | 124.60 | 6.2% | 118.15 | 84.57 | 75.14 |
| Miscellaneous | 104.40 | 103.90 | -15.6% | 114.03 | 102.89 | 85.81 |
| Petroleum | 264.40 | 216.50 | 53.5% | 207.13 | 135.26 | 110.06 |
| KR-CRB Spot Commodity Price Index | 03/01/05 | 12/28/04 | Y/Y | 2004 | 2003 | 2002 |
| All Commodities | 294.44 | 293.42 | -2.4% | 293.42 | 282.59 | 244.31 |
by Louise Curley March 7, 2005
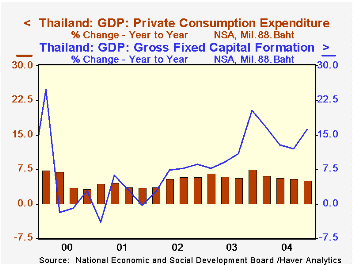
Thailand's seasonally unadjusted Real Gross Domestic Product rose 5.05% in the fourth quarter of 2005 over the fourth quarter of 2004. The year over year rate of growth has decelerated during the year from the first quarter rate of 6,70%. For the year as a whole, GDP was up 6.05% in 2004, compared with 6.89% in 2003, 5.33% in 2002 and 2.17% in 2001.
A fall off in the year to year increase in private consumption and a much larger increase in imports than in exports largely offset increases in government consumption, inventories and gross fixed investment. The year to year changes in private consumption are compared with gross fixed investment in the first chart while the second chart compares the year to year changes in exports with those in imports.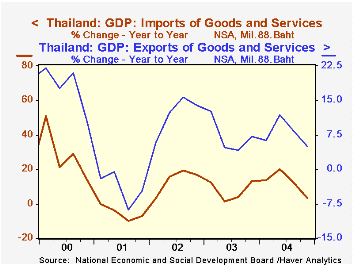
While real GDP growth, for the year as a whole, decelerated slightly in comparison with 2003, inflation as measured by the deflator more than doubled from 1.90% in 2003 to 4.55% in 2004.
| Thailand: GDP Year/Year % Changes |
Q4 05 | Q3 05 | Q2 05 | Q1 05 | 2004 | 2003 | 2002 | 2001 |
|---|---|---|---|---|---|---|---|---|
| GDP (1988 Bahts) | 5.05 | 6.09 | 6.44 | 6.70 | 6.05 | 6.89 | 5.33 | 2.17 |
| Private Consumption | 5.14 | 5.63 | 5.68 | 6.17 | 5.65 | 6.44 | 5.28 | 4.12 |
| Government Consumption | 5.18 | 0.27 | 4.94 | 7.03 | 4.13 | 2.00 | 1.78 | 2.49 |
| Gross Fixed Investment | 16.16 | 12.01 | 12.86 | 16.65 | 14.35 | 11.88 | 6.54 | 1.13 |
| Inventories* | 17.58 | 18.59 | 10.76 | -27.31 | 19.63 | 9.04 | 6.15 | 10.14 |
| Exports | 5.10 | 8.37 | 11.84 | 6.22 | 7.78 | 7.03 | 11.99 | -4.21 |
| Imports | 3.58 | 12.46 | 20.09 | 13.54 | 12.14 | 7.65 | 13.69 | -5.50 |
| Deflator | 6.07 | 5.10 | 4.81 | 2.20 | 4.55 | 1.90 | 0.69 | 2.11 |
| GDP (nominal) | 11.42 | 11.51 | 11.55 | 9.05 | 10.89 | 6.09 | 6.09 | 4.28 |

Tom Moeller
AuthorMore in Author Profile »Prior to joining Haver Analytics in 2000, Mr. Moeller worked as the Economist at Chancellor Capital Management from 1985 to 1999. There, he developed comprehensive economic forecasts and interpreted economic data for equity and fixed income portfolio managers. Also at Chancellor, Mr. Moeller worked as an equity analyst and was responsible for researching and rating companies in the economically sensitive automobile and housing industries for investment in Chancellor’s equity portfolio. Prior to joining Chancellor, Mr. Moeller was an Economist at Citibank from 1979 to 1984. He also analyzed pricing behavior in the metals industry for the Council on Wage and Price Stability in Washington, D.C. In 1999, Mr. Moeller received the award for most accurate forecast from the Forecasters' Club of New York. From 1990 to 1992 he was President of the New York Association for Business Economists. Mr. Moeller earned an M.B.A. in Finance from Fordham University, where he graduated in 1987. He holds a Bachelor of Arts in Economics from George Washington University.
More Economy in Brief


