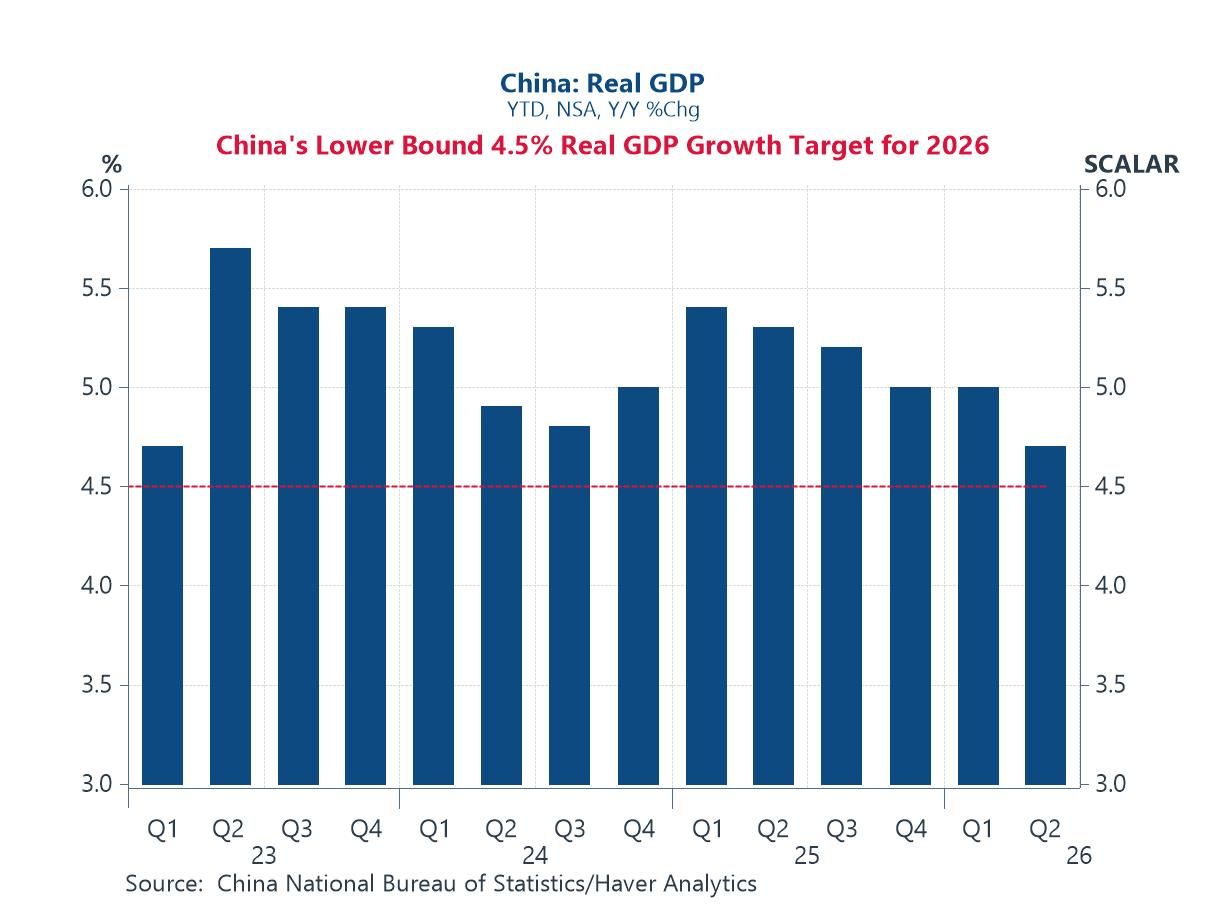
Haver Analytics
Haver Analytics

Economy in Brief

    • Prices of food and energy fell sharply, while prices of trade services surged.
    • Other noisy areas (transportation & warehouse services, construction) posted high-side increases.
    • Excluding the (apparently) random shifts, results were tame.
    • Headline +0.3% m/m, first m/m rise since August; -0.4% y/y, 11th consecutive y/y fall.
    • Residential private construction +1.5% m/m, led by a 1.8% rebound in home improvement building.
    • Nonresidential private construction -0.7% m/m, fifth m/m decline in six months.
    • Public construction -0.5% m/m, reflecting drops in both residential & nonresidential public buildings.
  • More countries have reported new results or firmed up their GDP results for 2025Q4. In the EMU, GDP grows by 1.3% year over year in the fourth quarter. The large EMU economies (Big Four) grow by 1% on that horizon, while the rest of the community grows at twice that pace, at 2.1%. U.S. growth on that timeline is 2.2%; Japan’s is 0.2%; and the United Kingdom grows by 0.9%. They are all weak compared to past standards. None of them rank at or above their respective 50th percentile standings on growth rates dating back to 1997.

    In Europe, EMU nonmember Denmark’s growth at 3% has an over 50th percentile ranking, at 78.3 percentile mark. Ireland’s growth has a 60.9 percentile standing, while Italy and Portugal have growth rates near their respective 55th percentiles—above their respective medians but not by a lot.

  • Over the past few days, financial markets have been navigating a fresh wave of policy and geopolitical cross-currents, with the US Supreme Court ruling on executive tariff authority adding a new layer of uncertainty to the trade outlook. At the same time, the AI investment boom continues to provide an important cyclical tailwind, even as investors remain alert to valuation risks, while renewed tensions involving Iran have reintroduced an energy risk premium. Against that backdrop, this week’s charts paint a picture of a global economy that is still expanding but becoming more differentiated. Latest flash PMI surveys confirm that global activity remains in growth territory despite some cooling in the US (chart 1). Strong semiconductor exports from Korea (chart 2) and surging US data-centre investment (chart 3) both underscore the continued force of the AI capex cycle, while a strong pickup in German capital goods orders (chart 4) hints at a more traditional, policy-linked investment impulse emerging in Europe. Meanwhile, the tight co-movement between oil prices and US front-end yields highlights (chart 5) the ongoing macro sensitivity to energy markets, and the recent downward drift in Japanese government bond yields — alongside softer data surprises — suggests that global bond markets may be receiving at least a modest anchoring impulse from Japan (chart 6).

    • New claims rose by 4,000 to 212,000.
    • Continuing claims declined by 31,000 to 1.833 million.
    • The insured unemployment rate remained at 1.2% for the 12th consecutive week.
  • EU Commission indexes that assess economic performance for the countries in Europe and in the European Monetary Union slipped in February to 98.3 from 99.3 in January; however, the February reading is still relatively strong by recent standards and leaves the index largely in an uptrend.

    The February readings saw the industrial sector unchanged, a small upward move in consumer confidence, and a one-point backtracking in construction, as retailing improved by a point. The services sector index stepped back by two points, putting it back at its December level.

    Ranking standings for economic groups The key ranking of the sectors in February show only two of the sectors with readings above their medians (i.e., above a ranking of 50%). Those sectors are retailing with a queue standing in its 60.4 percentile and construction with its queue standing in its 79.3 percentile. Consumer confidence continues to be the weakest with a 27.8 percentile ranking, services check in with a 33.4 percentile ranking, and the industrial sector has moved up to a 43.6 percentile ranking. However, the overall monetary union ranking is only in its 41st percentile, substantially below its historic median which resides at a standing at the 50-percentile mark.

    Country level performance Beyond the sectors, there are 18 of the 20 monetary union countries that provide early readings to this survey. Eleven countries showed weakened performance in February compared to January. In January, seven countries had weakened relative to December. In December, seven countries had weakened relative to November. However, in December, four of the countries that weakened were the four largest economies in the monetary union. In January, none of the largest four economies weakened month-to-month. Now, in February, we have three of the four largest economies weakening month-to-month, with the other one, Spain, posting an unchanged reading. The large countries in the monetary union have begun to have a little more difficulty over these last three months.

    Standings by country Percentile-standing data showed that, of the 18 countries in the table, only 8 have readings that place them above their historic medians on data back to the mid-1980s. The large countries have split performance, with Italy reporting a 59.8 percentile standing and Spain reporting a 72.4 percentile spending, while the two largest monetary union economies, Germany and France, post readings in the 23rd percentile for Germany and the 44th percentile for France. The ranking for the monetary union as a whole is at its 41st percentile. That compares to an unweighted average ranking in the 44th percentile for all the countries when their individual rankings pooled and averaged. The two ratings are close together.

    Apart from the Big Four Among the rest of the monetary union members, countries with readings above the 50th percentile are Malta, Greece, Lithuania, Latvia, the Netherlands, and Cyprus. Four countries vie for having the weakest reading in the table, with readings in their 20th percentile region. That list includes Big Four member Germany with the 23.5 percentile standing, Slovakia with a 23.8 percentile standing, Belgium with a 23.1 percentile standing, and Austria with a 22.1 percentile standing. There is considerable heterogeneity among the rankings of the monetary union member countries across all size classes. In addition, as we saw above, looking at the sectors, the sector rankings varied from a low of 27th percentile standing for consumer confidence to a high of 79th percentile standing for construction.

    • Applications for loans to purchase declined in the latest week while refinancing loan applications rose.
    • Effective interest rate on 30-year fixed loans declined 9bp to 6.24%.
    • Average loan size edged up.
  • Climate eased in March after improving in February. There still is a net improvement compared to January, but we must turn the calendar back to April 2024 to find a climate reading lower than the current level in March. In sum, there is no sense of ongoing improvement for climate in this report. The economic expectations and income expectations readings, which lag by one month, do show some improvement on a longer timeline. But the propensity-to-buy index is still quite weak.

    Climate at -24.7 in March has an 8.2 percentile standing on data back to 2002. The economic expectations, reading, fell back to 4.3 in February from 6.6 in January to set a 49-percentile standing. Income expectations rose to 6.3 in February from 5.1 in January. Income expectations have a 42.4 percentile standing. The propensity to buy weakened sharply to -9.3 in February from -4 in January. Its percentile standing is at a 30.7 percentile level, a bottom one-third standing.

    The table also presents consumer confidence readings for three other European economies. Among them, Italy has the strongest ranking at a 74-percentiel standing. The Italian reading is up-to-date through January and has been showing improvement. The United Kingdom and France have similar standings. The U.K. standing is at its 43.7 percentile mark, below its median on this timeline. The U.K. reading is up-to-date through January and has been showing a tendency to improve. France has a rank standing at a 39.7 percentile; it is up-to-date through February. The index has been very slowly improving.