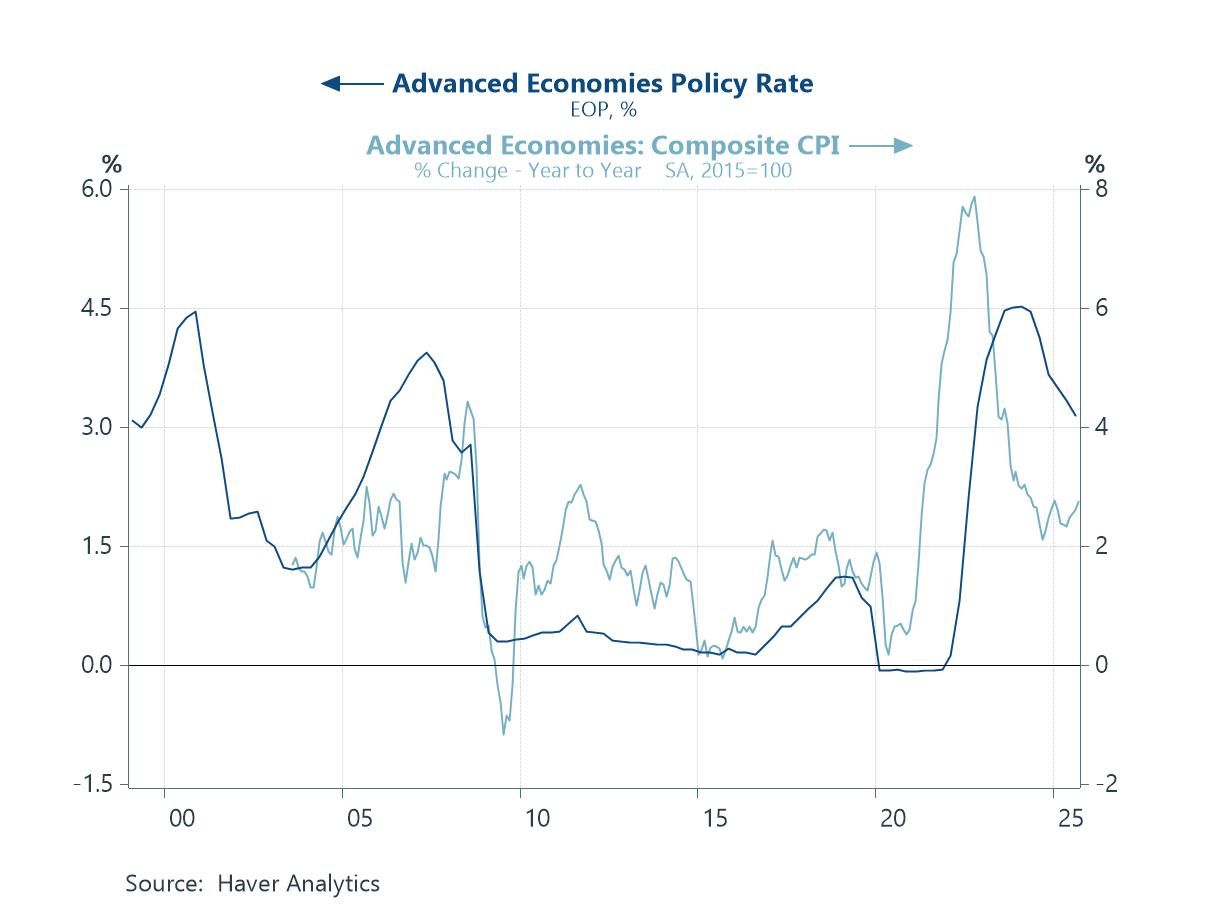
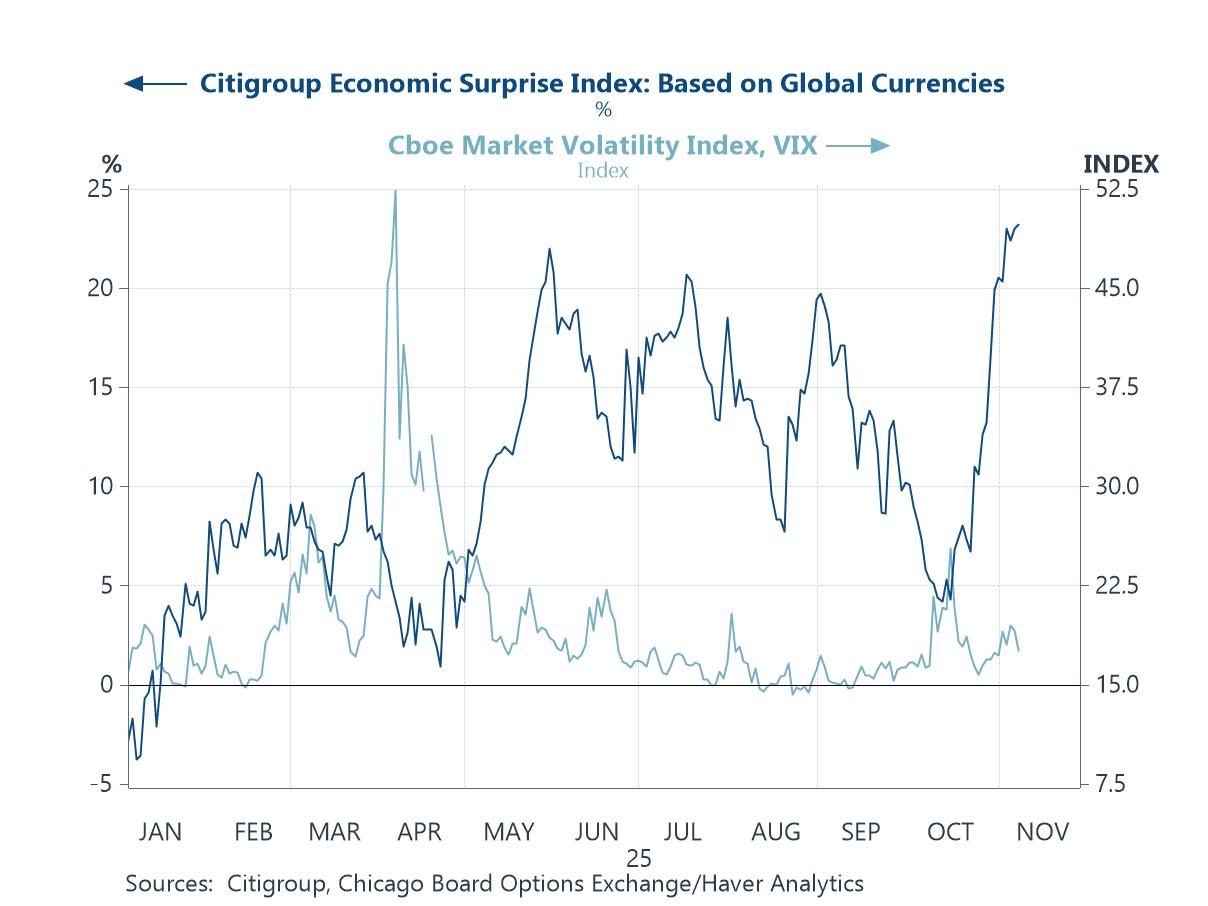
Financial markets have experienced renewed gyrations in recent weeks, as shifting geopolitical risks, questions around Federal Reserve independence, renewed talk of US dollar “debasement,” and ongoing enthusiasm surrounding artificial intelligence have combined to drive volatility across asset classes. These cross-currents have also contributed to a degree of rotation away from high-flying technology stocks, as investors reassess valuations and the timing of anticipated AI-driven gains. Against this backdrop, the charts in this week’s COTW highlight several important themes. Policy rate expectations now appear more balanced globally, marking a clear shift away from the one-sided easing bias of the past two years (chart 1), even as resilient US data—underscored by the unexpected jump in the January ISM index and a run of positive economic surprises—continues to complicate the outlook for monetary easing (chart 2). At the same time, US financial conditions remain relatively benign, with limited evidence of widespread credit stress or aggressive tightening in lending standards (chart 3). Meanwhile, the sharp rebound in semiconductor sales and the accelerating rollout of large-scale AI models underscore why investors remain so focused on the AI narrative, even as Europe lags behind due to weaker industrial momentum and a smaller footprint in advanced chip production (charts 4 and 5). Finally, while some scepticism about AI’s ultimate economic impact persists, the latest survey results suggest a moderation in concerns that markets are materially overestimating its gains (chart 6). Taken together, these developments paint a picture of a US economy that remains more resilient than many had anticipated, set against a financial landscape increasingly shaped by powerful—if sometimes competing—narratives around geopolitics, policy, and technological transformation.
Introducing
Andrew Cates
in:Our Authors
Andy Cates joined Haver Analytics as a Senior Economist in 2020. Andy has more than 25 years of experience forecasting the global economic outlook and in assessing the implications for policy settings and financial markets. He has held various senior positions in London in a number of Investment Banks including as Head of Developed Markets Economics at Nomura and as Chief Eurozone Economist at RBS. These followed a spell of 21 years as Senior International Economist at UBS, 5 of which were spent in Singapore. Prior to his time in financial services Andy was a UK economist at HM Treasury in London holding positions in the domestic forecasting and macroeconomic modelling units. He has a BA in Economics from the University of York and an MSc in Economics and Econometrics from the University of Southampton.

Publications by Andrew Cates

 Global| Feb 05 2026
Charts of the Week: Balanced Policy, Resilient Data and AI Narratives
by:Andrew Cates
|in:Economy in Brief
 Global| Jan 29 2026
Charts of the Week: Weaker Dollar, Stronger Tech
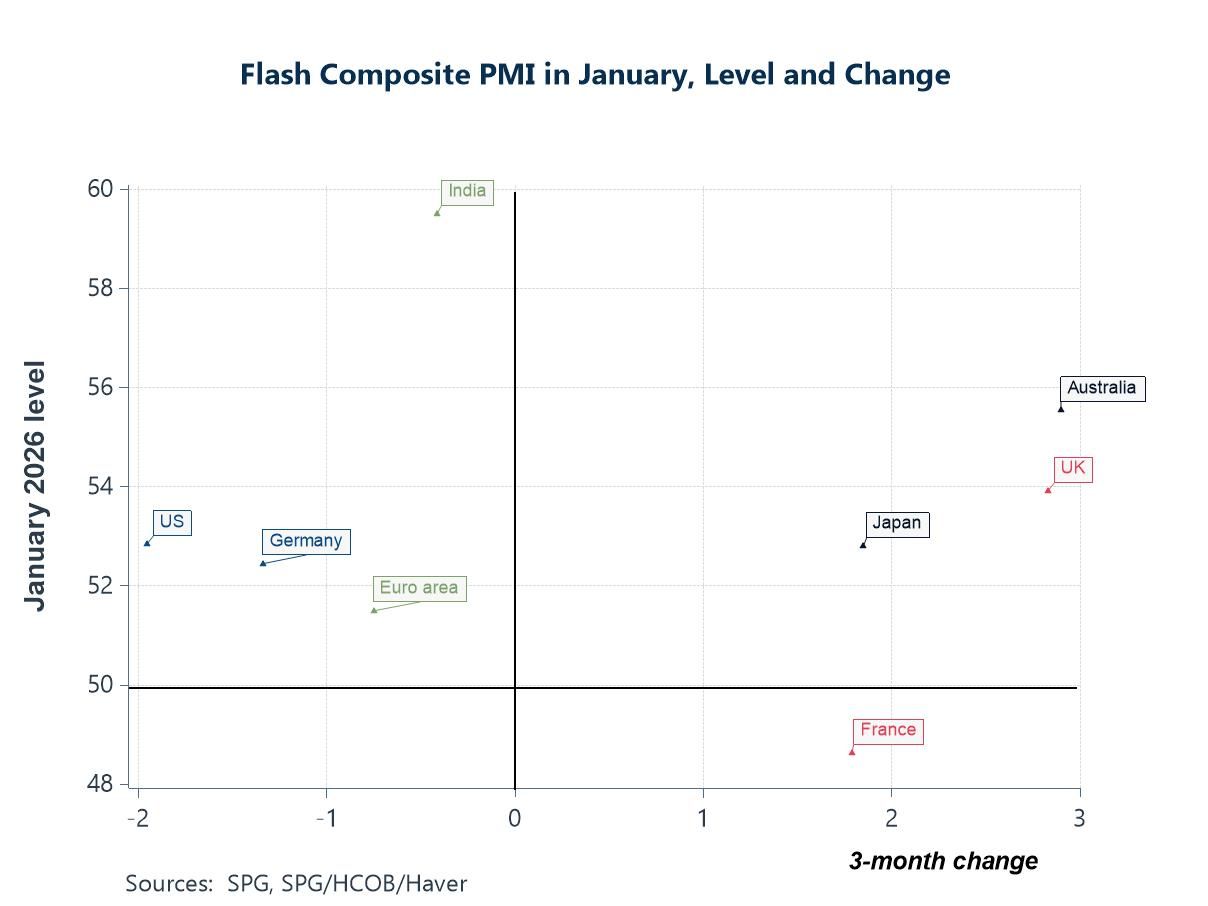
Financial markets have seen renewed gyrations in recent weeks, with a weaker US dollar, higher interest rate volatility and shifting capital flows reviving discussion of a “Sell America” narrative — so far more a marginal rebalancing than a wholesale retreat. The Federal Open Market Committee left the federal funds rate unchanged at its latest meeting, as widely expected, but communications around the outlook for future easing were arguably a little more hawkish than anticipated, reinforcing a cautious and increasingly data-dependent policy stance. In our charts this week we begin with January’s flash PMIs, which point to ongoing expansion across most major economies but with clear cross-country divergence in momentum (chart 1). That uneven real-economy picture has been mirrored in FX: the broad trade-weighted dollar depreciated through the first half of 2025, stabilised later in the year, but has now softened more abruptly at the start of 2026—suggesting a shift in risk premia and capital-flow dynamics (chart 2). Consistent with that, consumer confidence has weakened noticeably in the US relative to the euro area and UK, with the deterioration looking more tied to politics and labour-market perceptions (chart 3). Even so, global equity sentiment has remained comparatively upbeat, supported by a still-favourable macro mix in which global growth surprises have tended to run ahead of expectations while inflation surprises have been softer—tentatively consistent with an improving supply-side backdrop that markets increasingly associate with AI (chart 4). Finally, that theme is reinforced by hard activity indicators: US orders and imports of advanced technology products remain strong (chart 5), and Taiwan’s production data show a parallel surge in electronics output upstream (chart 6), pointing to a still-powerful global tech cycle even as broader macro and market narratives become more unsettled.
by:Andrew Cates
|in:Economy in Brief
- Global| Jan 29 2026
Are We In An AI Bubble?
Excess, innovation and why this boom may still have room to run
Recent weeks have seen financial markets gripped by a shifting mix of narratives. A weaker US dollar, rising rate volatility and renewed geopolitical uncertainty have revived talk of a tentative “sell America” trade, as investors reassess US exceptionalism after several years of outperformance. At the same time, global equity markets have remained remarkably resilient, supported in large part by continued optimism around artificial intelligence and the powerful investment cycle it has unleashed.
Against this unsettled backdrop, a familiar question has returned to the centre of market debate: are prices being driven by fundamentals, or by faith? With artificial intelligence, that conversation has clearly arrived. Equity markets — particularly in the United States — have surged on the back of a relatively small group of AI-exposed firms that now account for a striking share of index gains. Valuations increasingly rest on the assumption that AI will deliver a sustained uplift to productivity, profits and long-run growth. Investors are no longer debating whether AI will transform the economy; instead, they are debating how quickly — and how completely — those gains will materialise.
Lessons From History
History offers a useful starting point. Truly transformative technologies almost always arrive alongside periods of financial excess. Railroads, electricity, telecoms and the internet all produced extraordinary investment booms that ultimately reshaped economic structures, even as they destroyed large amounts of capital along the way. The presence of a bubble never meant the technology was flawed. It meant expectations moved faster than cash flows, infrastructure deployment and balance-sheet reality. AI fits this historical pattern uncomfortably well.
In this environment, narrative often dominates near-term profitability, and that is typically how transformative technologies diffuse rapidly across the economy. But where bubbles become truly dangerous is not via investor enthusiasm itself, but in the financing structures that accompany large infrastructure build-outs. Equity investment in diversified firms with strong balance sheets is fundamentally different from debt-financed bets on long-lived assets whose viability depends on uncertain demand and rapidly evolving technology. Yet we are already seeing significant capital being channelled into data centres, energy infrastructure and specialised AI facilities, increasingly funded through project-level vehicles and long-dated financing. These investments rest on assumptions about sustained utilisation, manageable energy costs and technological continuity — assumptions that inevitably carry risk.
This should feel familiar. The late-1990s telecoms boom was not undone because fibre optics were useless, but because capacity was financed almost entirely with leverage long before revenues caught up. When pricing power collapsed, investors absorbed enormous losses, even as the infrastructure went on to support the digital economy that followed.
The Macro Dimension
However, there is also a macro dimension in this debate that deserves more attention, and this is where today’s AI boom still looks somewhat different from past excesses. The chart below contrasts private non-residential investment in the US with the financial balance of non-financial corporations. During the dot-com era, corporate investment surged at the same time as the corporate sector moved deep into financial deficit. Firms were spending far beyond internal cash flows, and increasingly reliant on external financing — particularly debt — to fund speculative expansion. That combination of soaring investment and widening financial imbalances was a classic Minsky-style warning sign.
by:Andrew Cates
|in:Viewpoints
 Global| Jan 22 2026
Charts of the Week: Seeing Green
This week’s data and market moves have been framed by an abrupt escalation in geopolitical tensions surrounding Greenland, which has served as a catalyst for broader financial unease rather than a standalone shock. The episode has sharpened investor focus on US policy predictability, amplifying concerns already evident in the charts on EU–US trade exposure, where tariff threats risk feeding directly into confidence effects and capital flows. At the same time, recent turbulence in Japanese government bonds appears to have been an underappreciated driver of the sell-off in US Treasuries, highlighting how global capital reallocation—rather than geopolitics alone—has contributed to higher US yields. These forces intersect with growing questions around the durability of US monetary credibility, as inflation expectations have shown signs of decoupling from traditional oil-price anchors, raising the sensitivity of markets to any perceived constraints on the Federal Reserve. Beyond the US, UK data delivered a modest upside surprise in headline inflation, with persistent services and wage pressures reinforcing a cautious policy backdrop for the Bank of England. In China, meanwhile, Q4 GDP growth of 4.5% y/y kept full-year expansion aligned with the government’s target, but continued weakness in the property sector remains a significant drag on investment and household confidence. Taken together, the week’s developments point to a global outlook increasingly shaped by geopolitical risk, capital-flow dynamics and domestic structural constraints, rather than by straightforward cyclical momentum alone.
by:Andrew Cates
|in:Economy in Brief
 Global| Jan 15 2026
Charts of the Week: Between Optimism and Uncertainty
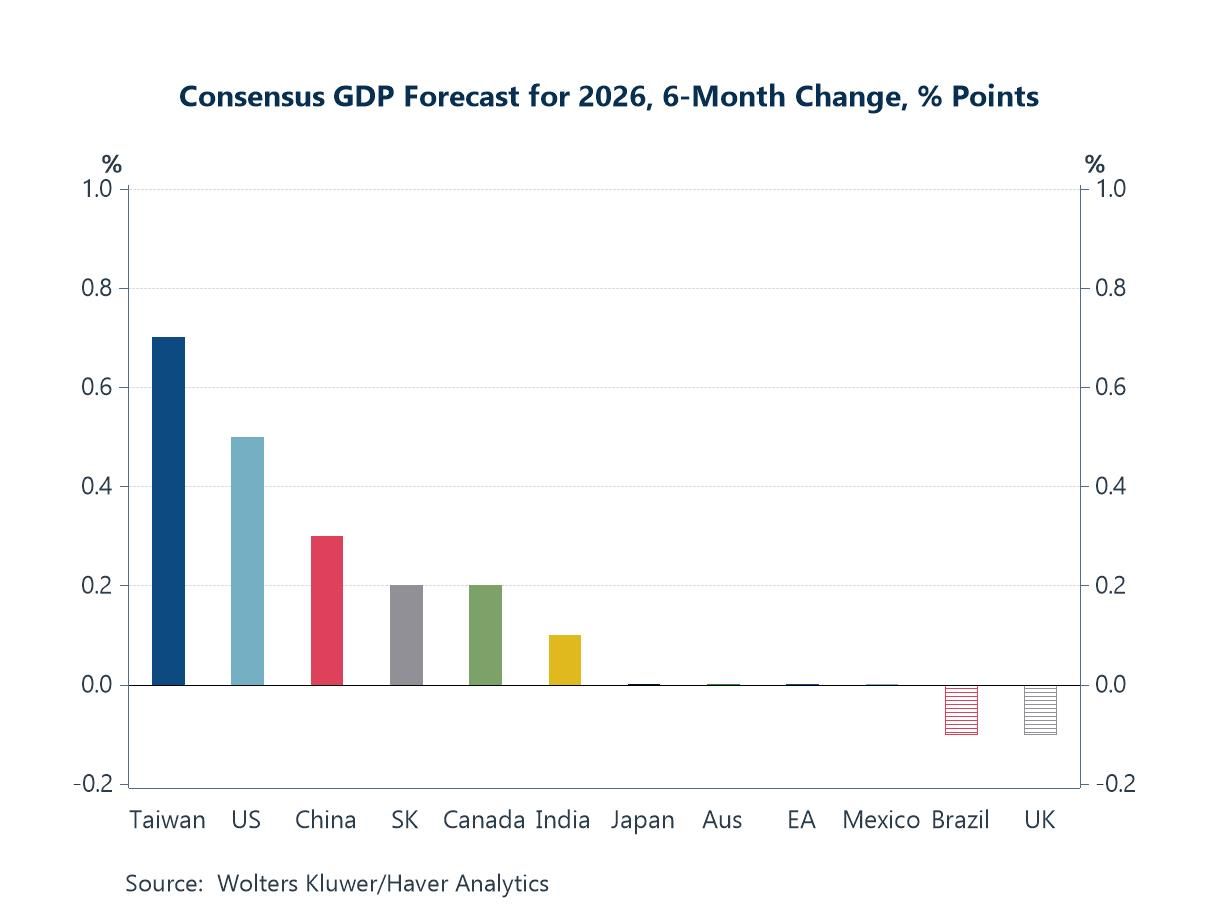
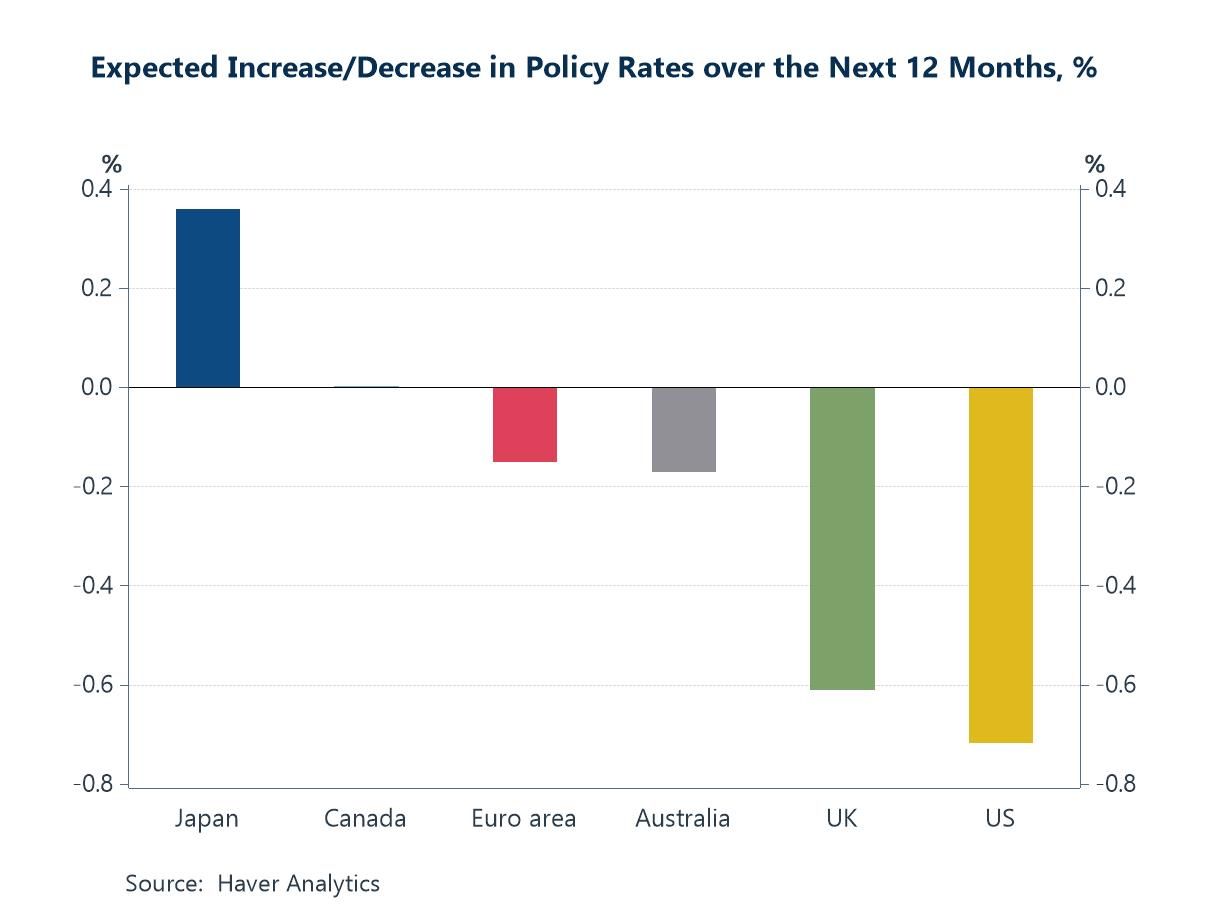
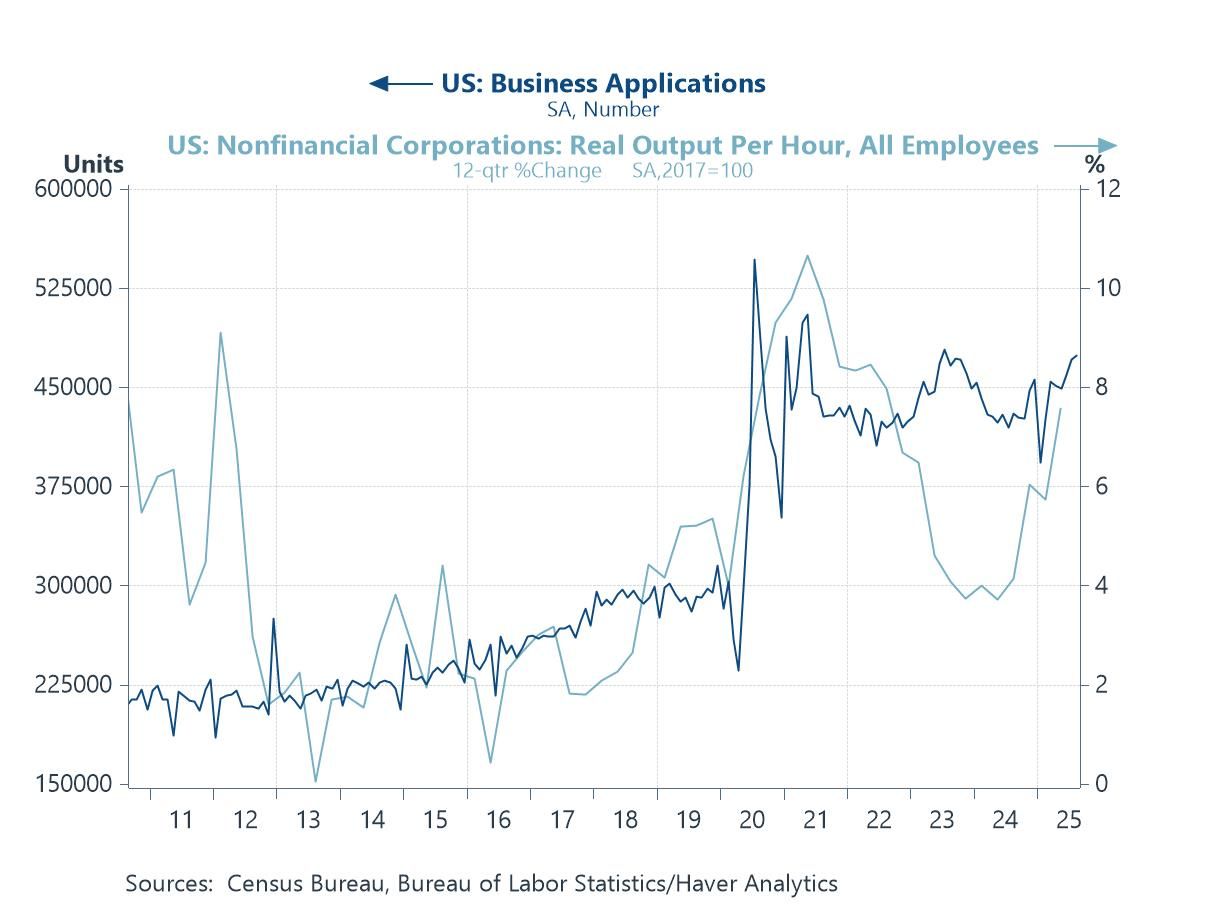
The global backdrop remains unsettled, reflected in rising gold prices amid geopolitical tensions—most recently around Venezuela—and renewed political noise, including questions over Federal Reserve independence. At the same time, however, many major equity indices remain at or close to all-time highs, buoyed by optimism around AI and reinforced by a run of relatively benign US inflation readings. Against this mixed backdrop, the charts this week point to a global outlook that is becoming more differentiated rather than uniformly weaker. Blue Chip forecasts for 2026 growth have edged higher over the past six months, with upgrades concentrated in economies most exposed to the AI investment cycle, notably the US and parts of Asia (chart 1). Central bank expectations remain fluid: while panelists broadly anticipate easing by the Fed and Bank of England, conviction around timing is limited, and the Bank of Japan remains an outlier with further tightening still expected (chart 2). In the UK, that uncertainty sits alongside a deteriorating data flow, with negative economic surprises increasingly tilting market expectations toward an earlier BoE rate cut (chart 3). Turning to the US, special questions highlight a divide over whether AI is already having a noticeable macro impact or whether its effects will emerge more gradually, a tension that mirrors concerns about over-optimism in financial markets (chart4). That debate is echoed in the recent pick-up in US productivity growth and the step-change in business formation—developments that may reflect AI-related dynamics but which also warrant caution given the historically cyclical nature of productivity (chart 5). Finally, China’s trade data point to a continued re-orientation of export growth away from the US and toward Europe and ASEAN, consistent with evolving US trade policy and broader supply-chain realignment (chart 6).
by:Andrew Cates
|in:Economy in Brief
 Global| Jan 08 2026
Charts of the Week: Cooling Inflation, Diverging Growth
Over the past few weeks, global financial markets have taken comfort from cooling inflation, resilient earnings and continued upside surprises in the dataflow, with equity markets extending gains as confidence in a soft-landing outcome has firmed. While AI-related optimism was questioned toward the end of last year, amid valuation concerns and uncertainty over near-term payoffs, sentiment has improved again in recent days. Latest business surveys suggest little immediate cause for alarm on the global growth front (chart 1), despite clear signs of divergence across regions. At the same time, there are few near-term inflation concerns evident in the data, with global supply-chain pressures remaining subdued (chart 2). Taken together, these developments leave little immediate challenge to the prevailing outlook for monetary policy, with expectations for further gradual easing across several major economies remaining broadly intact (chart 3). At the same time, geopolitical shocks — most notably the upheaval in Venezuela — have reignited focus on energy market risks and sovereign debt uncertainties, adding complexity to oil price expectations and fiscal trajectories (chart 4). Shifting focus, China’s role also continues to remain pivotal: surplus industrial capacity and competitive export pricing continue to shape global trade and exert disinflationary influence (chart 5). Against this backdrop, public debt levels that are both elevated and still rising in many large economies underscore the structural imbalances that could limit policy flexibility and amplify market sensitivities in the immediate months ahead (chart 6).
by:Andrew Cates
|in:Economy in Brief
 Global| Dec 18 2025
Charts of the Week: The Upside Risks
This marks our final Charts of the Week publication for 2025 The next edition will be released on Thursday 8 January.
Last week’s Charts of the Week focused on the darker tail risks hanging over the 2026 outlook: the possibility of monetary policy mis-calibration, that geopolitics and trade fragmentation further disrupt supply chains, and that elevated debt levels—particularly in the public sector—reassert themselves as a drag on growth. This week’s charts take a deliberately different tack. Taken together, they highlight a set of upside risks that are possibly underappreciated in current forecasts. For example, policy easing across advanced economies may extend further than expected as disinflation feeds on itself (chart 1); oil prices could surprise on the downside as inventories rebuild (chart 2); US productivity may deliver incremental but meaningful gains sooner than assumed (chart 3); the US economy itself could continue to benefit from an absence of private-sector financial stress (chart 4); India’s growth momentum might firm again as inflation pressures recede (chart 5); and, more broadly, parts of the Global South appear increasingly capable of generating their own demand impulse, supported by favourable demographics and income growth (chart 6). None of these forces is guaranteed, and each carries its own caveats—but together they suggest that, having spent much of the past year fixated on downside risks, the risks to global growth in 2026 may be more evenly balanced than is widely assumed.
by:Andrew Cates
|in:Economy in Brief
 Global| Dec 11 2025
Charts of the Week: The Downside Risks
As 2025 draws to a close, the global economy enters 2026 with a surprisingly resilient backdrop: equity markets are still trading near cycle highs, volatility is subdued, and consensus forecasts have been drifting upward in recent months—helped by a robust US economy, firmer momentum across Asia, and optimism that AI-related investment will continue to lift the medium-term outlook (chart 1). Against this relatively constructive starting point, we focus this week on the key downside risks that could challenge the consensus narrative next year: the possibility of monetary-policy miscalibration (chart 2); the gap between elevated policy uncertainty and unusually calm financial markets (chart 3); the risk that financial markets may be overestimating the gains from AI (chart 4); renewed strain in global trade (chart 5); and geopolitical tensions (chart 6). These risks do not dominate the baseline outlook, but they help frame the vulnerabilities that could matter if global conditions deteriorate. Next week, we will turn to the upside risks—the forces that could allow the world economy to outperform again in 2026.
by:Andrew Cates
|in:Economy in Brief
 Global| Dec 04 2025
Charts of the Week: Diverging Paths, Converging Risks
Global financial markets have been navigating a more unsettled backdrop in recent weeks, with choppier risk sentiment and shifting rate expectations reshaping the macro narrative. US assets have been particularly sensitive to signs of cooling labour-market momentum and the temporary loss of official payroll data during the government shutdown, while rising real yields in Japan and renewed fiscal tightening in the UK have added further cross-currents. Against this backdrop, Blue Chip forecasts point to a world edging gradually toward easier monetary policy, but with a striking divergence between a more dovish Fed and a still-normalising Bank of Japan (chart 1). The softening in US private payroll growth, captured by the ADP data, reinforces the case for Fed easing at a time when official data are unavailable (chart 2). In the euro area, sticky underlying inflation could leave the ECB wary of further meaningful cuts (Chart 3). Japan’s climb in real JGB yields, underpinned by stronger capex and supportive policy signals, continues to reverberate through global rate markets (chart 4). In the UK, the gilt–Treasury spread has widened over the year but narrowed slightly post-Budget as investors priced the growth-dampening effects of fiscal tightening (chart 5). And in the global goods sector, while the manufacturing PMI still points to only mediocre growth, the revival in South Korean semiconductor exports underscores the extent to which AI-related demand remains one of the few clear bright spots in an otherwise subdued industrial landscape (chart 6).
by:Andrew Cates
|in:Economy in Brief
 Global| Nov 20 2025
Charts of the Week: The Year Ahead
As 2025 draws to a close, the global economy feels caught between relief and unease. Inflation has eased but not fully retreated, monetary-policy cycles are pulling in different directions, markets are oscillating between AI-driven enthusiasm and valuation nerves, and geopolitical tensions are pressing harder on trade, energy and investment flows. Against this backdrop, the twelve themes that follow set out the forces most likely to shape the macro, market and policy landscape in 2026. They range from the pivotal questions around whether AI will deliver visible productivity gains, how far the AI narrative can continue to support markets, and how policymakers will manage an unusually uncertain interest-rate outlook, to the broader pressures created by fiscal strains, climate stress, shifting trade patterns, geopolitical fragmentation, political transitions, and demographic change. Taken together, they offer a map of the terrain investors and policymakers will need to navigate in the year ahead — a world where cyclical dynamics and structural shifts arguably interact more tightly than at any point in the past decade, and where the biggest surprises are likely to emerge from those intersections.
 Global| Nov 13 2025
Charts of the Week: The Year in Review
The global economic story of 2025 has been one of resilience amid disruption. Despite a succession of shocks — from a renewed U.S.–China trade confrontation and elevated geopolitical risks, to a sharp rise in fiscal activism and the energy-intensive AI investment boom — the world economy has held up better than many feared. Activity data have consistently surprised on the upside, supporting buoyant equity markets and keeping volatility contained. Meanwhile, inflation has continued to ease and central banks have cautiously shifted toward easier policy, even as large government deficits have kept longer-term real yields elevated. At the same time, US tariff policies have re-emerged as a defining force in global trade, with steep new duties on Chinese, Canadian, and Mexican goods disrupting supply chains and prompting renewed fragmentation in world commerce. These measures have cooled bilateral trade flows and added another layer of uncertainty to an already unsettled policy environment. Yet uncertainty itself remains the dominant feature of 2025 — geopolitical tension, technological exuberance, and diverging fiscal and monetary paths have left investors navigating a world where optimism and fragility coexist.
by:Andrew Cates
|in:Economy in Brief
 Global| Nov 06 2025
Charts of the Week: Uneven But Unbroken
Recent financial market developments have been shaped by a renewed bout of volatility, with heightened concerns about stretched AI valuations triggering a big correction across parts of the tech sector. This comes against a backdrop of lingering uncertainty in Washington, where the US government shutdown has continued to delay the release of several key economic reports, clouding visibility on near-term momentum. Still, the broader macro signals offer a mixed but nuanced picture. Global manufacturing PMIs have continued to hold up, hinting that underlying industrial momentum remains resilient (chart 1). The latest US Senior Loan Officer Survey points to a stabilisation in credit conditions—banks remain cautious, but the most intense phase of tightening may have now passed (chart 2). In China, the October PMIs reflected renewed softness in manufacturing alongside a still-steady services sector, tentatively suggesting that growth may be rebalancing, albeit at a weaker aggregate pace of growth (chart 3). Australia’s inflation and labour market data, meanwhile, have complicated the case for near-term policy easing, with the RBA opting to stay on hold this week as core inflation remain sticky. In Argentina, currency weakness persists even as equity markets rally, highlighting the policy and market tension surrounding President Milei’s reform agenda (chart 5). And finally, at a more structural level, latest global emissions data serve as a reminder that energy, manufacturing, transport, and households remain the principal sources of CO₂—illustrating how the climate and energy transition will continue to shape the macro landscape well beyond the current economic cycle (chart 6).
by:Andrew Cates
|in:Economy in Brief
- of20Go to 1 page