Global| May 09 2024
Charts of the Week: Inflation Still Holds the Key
by:Andrew Cates
|in:Economy in Brief
Summary
Last week's softer-than-expected US data releases have sparked renewed hopes that the Federal Reserve may initiate an easing cycle in the coming months, and, in doing so, have reignited investors' appetite for risk. This week, our charts explore the messaging from some of those US data releases (see chart 1). We also examine the signals from this week’s final composite PMI data, and particularly how weaker US growth momentum currently contrasts with stronger growth momentum in many other major economies (chart 2). With inflation dynamics likely one of the drivers of this relative growth divergence, we next explore how a series of positive inflation surprises in the US recently contrasts with negative inflation surprises elsewhere (chart 3). Weaker oil prices in recent days may provide some relief to the US inflation outlook in the period ahead (chart 4), as could the further easing of global supply chain pressures that’s been signaled by latest data from the New York Fed (chart 5). Finally this week, and pivoting to Asia, we examine recent currency trends in some of the region's major economies (chart 6).
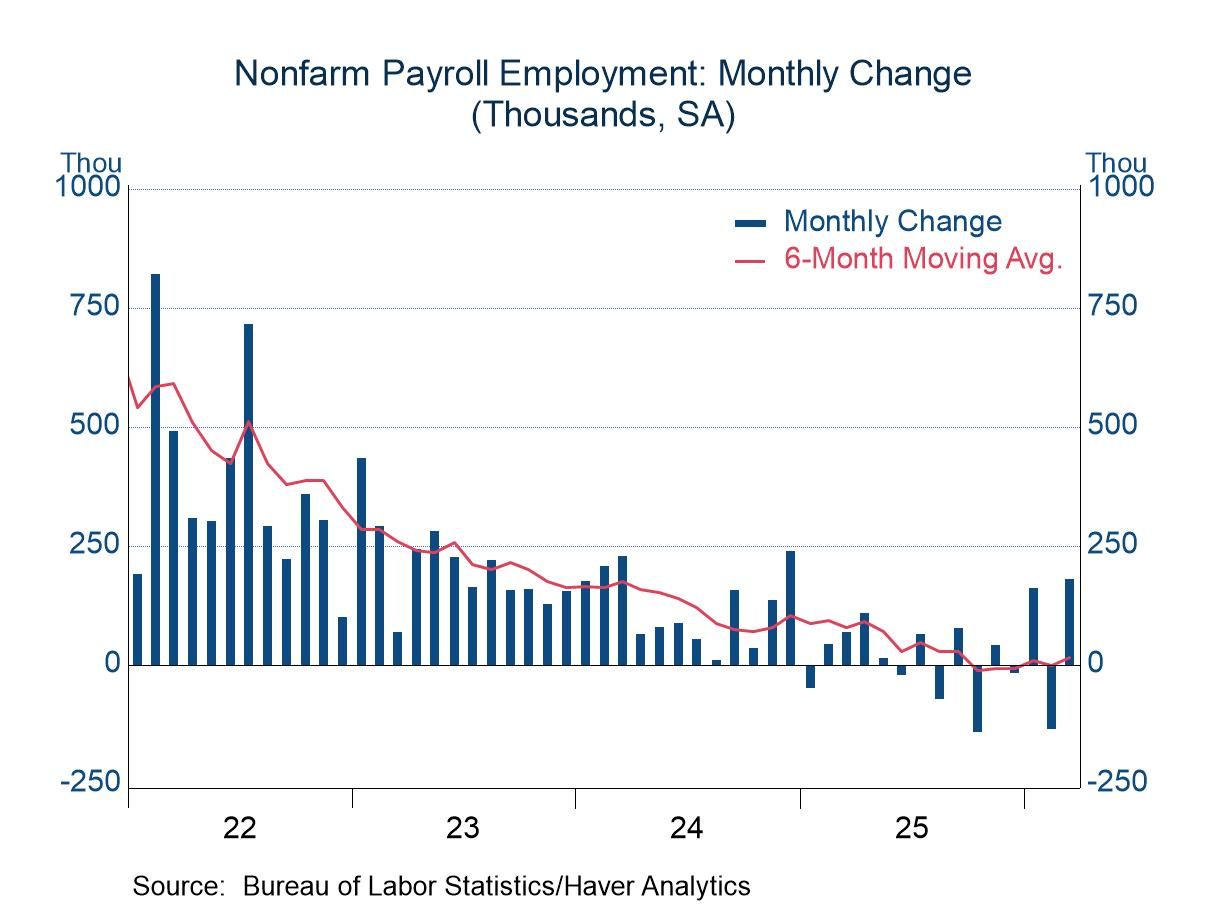
The US economy Last week’s US economic data releases almost universally disappointed forecasters’ expectations and have more generally flagged a slightly higher probability of a recession outcome in the coming months. For example, both the manufacturing and services ISMs declined into contraction territory in April. Weaker employment growth and a small step-up in the unemployment rate also indicate that growth momentum may be flagging. An indicator of recession risk generated by the Sahm Rule has certainly been climbing to more worrying levels (see chart 1 below). For the record, that rule asserts that a recession has begun when the three-month moving average of the national unemployment rate rises by at least 0.5 percentage points relative to its low during the previous 12 months.
Chart 1: The US Sahm unemployment recession indicator and the ISM composite index

US economic momentum versus the rest of the world Looking more broadly at global developments, this week’s PMI surveys (published by S&P Global) suggested that economic growth picked up in April in most major developed and developing economies. Looking at momentum over the past three months, however, also reveals a noteworthy anomaly. Specifically, and in line with the messages above, the US economy has been losing momentum according to these surveys, while other major developed and developing economies have been gaining momentum (see chart 2).
Chart 2: Composite PMIs: 3 month changes in selected developed and emerging economies

Global inflation surprises One reason for these relative shifts in growth momentum could concern the starting position of each economy. Many major economies, including the euro area and UK, were either in, or close to, a recession toward the end of last year. In contrast, the US economy has experienced relatively robust growth momentum over the last few months and up until now. Another noteworthy takeaway, however, from the recent dataflow concerns the unexpected pick up in US inflation compared with elsewhere (see chart 3). This pick-up may have eroded purchasing power and tightened financial conditions (through its impact on interest rate expectations), thereby acting as a brake on the US economy relative to other areas.
Chart 3: Citigroup inflation surprise index for the US, euro area and emerging markets

Oil prices and US Treasury yields Another critical element in this discussion about growth and inflation is the oil price. That’s because oil price gyrations have played a big role in driving global inflationary pressures in recent years. And financial market participants appear to have noticed judging by the very tight correlation between the oil price and US Treasury yields over the last year or so (see chart 4). That oil prices have dropped back of late has accordingly been another factor driving the improvement in financial market sentiment in recent days.
Chart 4: Brent crude oil prices (advanced by 14 days) versus US 10 year Treasury yields

Global supply chain pressures and inflation surprises An additional factor that’s worthy of mention in this discussion is global supply chain pressure. As measured by an index that’s calculated by the New York Fed, those pressures have also been a big driver of global inflation in the post-pandemic era. And even now, small shifts in the degree of easing or tightening of those pressures appear to chime quite closely with inflation outcomes (see chart 5).
Chart 5: Global supply chain pressures index versus global inflation surprises

Asian currencies Finally—and largely due to shifts in relative interest rate expectations—the US dollar has been strong for most of the year. This strengthening has adversely affected Asian currencies, which have, on average, weakened by 4.4% against the dollar so far this year. The degree of depreciation among Asian currencies against the dollar has varied, however, with the Japanese yen experiencing the most significant weakening, while the Indian rupee has shown relative resilience. Recently, there have been notable strengthening moves in the yen, spurring speculation that these were driven by intervention from authorities. Regarding the rupee, potential reasons for its continued resilience include India’s positive yield differentials with the US and sustained investor optimism about India's economic prospects, among other factors.
Chart 6: Asia’s FX market performance


Andrew Cates
AuthorMore in Author Profile »Andy Cates joined Haver Analytics as a Senior Economist in 2020. Andy has more than 25 years of experience forecasting the global economic outlook and in assessing the implications for policy settings and financial markets. He has held various senior positions in London in a number of Investment Banks including as Head of Developed Markets Economics at Nomura and as Chief Eurozone Economist at RBS. These followed a spell of 21 years as Senior International Economist at UBS, 5 of which were spent in Singapore. Prior to his time in financial services Andy was a UK economist at HM Treasury in London holding positions in the domestic forecasting and macroeconomic modelling units. He has a BA in Economics from the University of York and an MSc in Economics and Econometrics from the University of Southampton.
More Economy in Brief