 Global| Jan 30 2009
U.S. Recession Intensifies; 3.8% Drop in Real GDP Is Sharpest Since 1982
by:Tom Moeller
|in:Economy in Brief
Summary
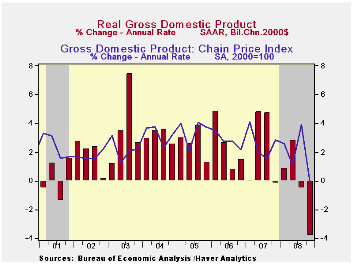
The current recession in economic activity intensified last quarter. Real GDP contracted at a 3.8% annual rate. Although, the rate of decline was less than the generally expected 5.4%, it was the deepest quarterly drop since the last, [...]
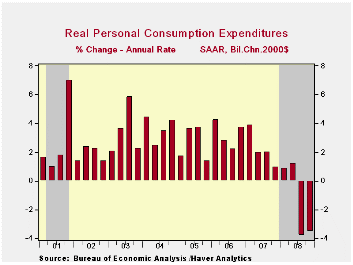
An improved foreign trade deficit added just 0.1 percentage points to 4Q GDP growth, held down by an outsized 19.8% decline in exports. Imports fell at a 15.7% rate with the developing domestic recession.
The estimate of the GDP chain price index fell by 0.1% (AR), the first quarterly decline since 1954. It was a give-back from the a strong 3.9% gain during 3Q. The 4Q drop was led by lower oil prices which pulled down the PCE deflator at a 5.5% annual rate, reversing all of the 3Q increase. The residential investment chain price index fell at an 8.2% annual rate but the business fixed investment price index rose 5.0%, about as it did during 3Q.
| Chained 2000$, % AR | 4Q '08 (Advance) | 3Q '08 | 4Q Y/Y | 2008 | 2007 | 2006 |
|---|---|---|---|---|---|---|
| GDP | -3.8 | -0.5 | -0.2 | 1.3 | 2.0 | 2.8 |
| Inventory Effect | 1.3 | 0.8 | 0.1 | 0.1 | -0.4 | 0.0 |
| Final Sales | -5.1 | -1.3 | -0.3 | 1.4 | 2.4 | 2.8 |
| Foreign Trade Effect | 0.1 | 1.1 | 1.4 | 1.4 | 0.6 | 0.2 |
| Domestic Final Demand | -4.9 | -2.2 | -1.5 | 0.0 | 1.8 | 2.6 |
| Chained GDP Price Index | -0.1 | 3.9 | 1.9 | 2.2 | 2.7 | 3.2 |

Tom Moeller
AuthorMore in Author Profile »Prior to joining Haver Analytics in 2000, Mr. Moeller worked as the Economist at Chancellor Capital Management from 1985 to 1999. There, he developed comprehensive economic forecasts and interpreted economic data for equity and fixed income portfolio managers. Also at Chancellor, Mr. Moeller worked as an equity analyst and was responsible for researching and rating companies in the economically sensitive automobile and housing industries for investment in Chancellor’s equity portfolio. Prior to joining Chancellor, Mr. Moeller was an Economist at Citibank from 1979 to 1984. He also analyzed pricing behavior in the metals industry for the Council on Wage and Price Stability in Washington, D.C. In 1999, Mr. Moeller received the award for most accurate forecast from the Forecasters' Club of New York. From 1990 to 1992 he was President of the New York Association for Business Economists. Mr. Moeller earned an M.B.A. in Finance from Fordham University, where he graduated in 1987. He holds a Bachelor of Arts in Economics from George Washington University.
More Economy in Brief


