 Global| Mar 02 2010
U.S. Petroleum & OtherCommodity Prices Move Higher
by:Tom Moeller
|in:Economy in Brief
Summary
A modest uptick in the pump price for regular gasoline last week to $2.70 took it to the highest level since January. This continued a trend of rising prices since early-2009, which followed a recession-related downturn. Yesterday, [...]
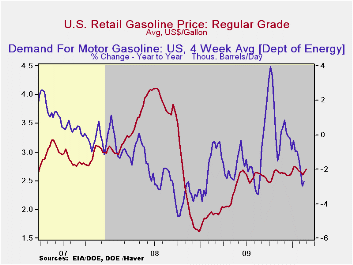
A modest uptick in the pump price for regular gasoline last week to $2.70 took it to the highest level since January. This continued a trend of rising prices since early-2009, which followed a recession-related downturn. Yesterday, the spot market price for a gallon of regular gasoline retraced some of that increase with a 3 cent decline. The figures are reported by the U.S. Department of Energy and can be found in Haver's WEEKLY & DAILY databases.
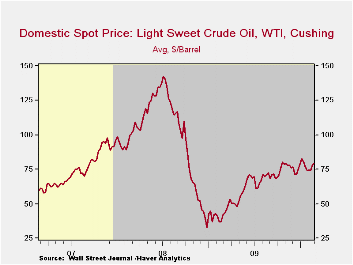
The price for a barrel of light sweet crude (WTI) fell last week to $79.26 and left it down from the early-January high of $82.59. However, crude oil prices have fueled the same rising trend for gasoline. Prices have risen from $71.53 early this past December and are more than double the December 2008 low of $32.37. Yesterday, the spot price fell moderately to $78.70.
Demand for gasoline fell 2.7% last week versus one year ago. That decline compared to a 3.9% increase at the beginning of October. The demand for residual fuel oil fell 3.5% y/y though the decline has eased from -40.4% in February. Distillate demand fell 11.3% y/y, a decline more moderate than the 21.6% y/y shortfall at the beginning of last July. Inventories of crude oil and petroleum products slipped in February but were up 1.1% from one year ago.
U.S. natural gas prices fell last week to an average $4.88 per mmbtu (+17.3% y/y) from the high of $6.50 early in January. Nevertheless they remained double the September low.
The energy price data can be found in Haver's WEEKLY database while the daily figures are in DAILY. The gasoline demand figures are in OILWKLY.
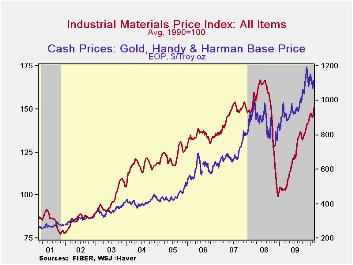
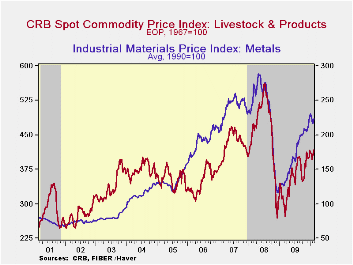
Outside of energy, commodity prices also have been strong. Copper has led the gain as scrap prices have more-than doubled since early last year. Scrap steel prices also have doubled during the same period. Not far behind in the metals area are aluminum prices, up by two-thirds. With improved housing activity has come strength in lumber prices which have risen more than 50% since early-2009. Cotton prices also have nearly doubled with improvement in consumer spending. In the agricultural area, foodstuffs including wheat, corn & butter, as well as livestock prices have risen by one-half. Finally, gold prices near $1,100 pounce have risen 50% since the fall of '08 and have roughly tripled since 2001.
| Weekly Prices | 03/01/10 | 02/22/10 | 02/15/10 | Y/Y | 2009 | 2008 | 2007 |
|---|---|---|---|---|---|---|---|
| Retail Regular Gasoline ($ per Gallon, Regular) | 2.70 | 2.66 | 2.61 | 39.7% | 2.35 | 3.25 | 2.80 |
| Light Sweet Crude Oil, WTI ($ per bbl.) | 79.26 | 78.30 | 73.91 | 89.6% | 61.39 | 100.16 | 72.25 |
by Tom Moeller March 2, 2010
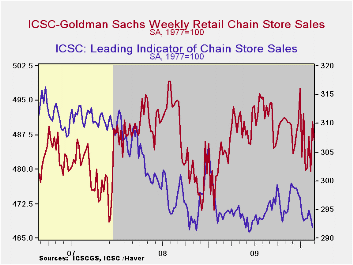
Weekly chain store sales gave back a piece of their prior week's improvement with a 0.8% slip. Since the spring of last year, sales have gyrated around a sideways trend.
The ICSC-Goldman Sachs retail chain-store sales index is constructed using the same-store sales (stores open for one year) reported by 78 stores of seven retailers: Dayton Hudson, Federated, Kmart, May, J.C. Penney, Sears and Wal-Mart.
During the last ten years there has been a 69% correlation between the year-to-year growth in chain store sales and the growth in general merchandise retail sales. The weekly figures are available in Haver's SURVEYW database.The leading indicator of chain store sales has been somewhat weaker and last week moved to the low end of its year-long range. This composite leading economic indicator is compiled from four series: (1) the MBA's volume index of mortgage applications for home purchase (2) the ABC News/Money magazine's survey of consumer buying conditions (3) new filings for jobless benefits and (4) the 30-year government bond yield.
| ICSC-UBS (SA, 1977=100) | 02/20/10 | 02/13/10 | 02/06/10 | Y/Y | 2009 | 2008 | 2007 |
|---|---|---|---|---|---|---|---|
| Total Weekly Chain Store Sales | 490.4 | 479.5 | 487.1 | 0.9% | 0.1% | 1.4% | 2.8% |
by Robert Brusca March 2, 2010
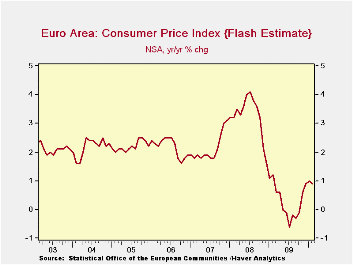
The EMU inflation chart tells a quick and dirty story of this business cycle without all the embellishments over banks lending, not-lending and financial crisis.
Once upon a time, inflation was steady. Then prices overheated. Economic activity subsequently plunged bringing inflation down sharply – it even negative turned Yr/Yr. All was not well. But then, weakness subsided and inflation crept back up. Now prices show signs of stabilizing with inflation around the 1% mark, well below the 2%-plus level where it had resided in the pre-crisis period. So is the inflation scare over? Will they all now live happily ever after?
Inflation fighting is no fairy tale. The recent urging of the IMF staff sho9uld make that clear; it said a higher inflation target might be ‘good for’ the US and Europe. It’s a stunning piece of work from an organization that has stepped on its own tail more than once too often. Fortunately Europe has been indignant about the suggestion and the US seems simply to have ignored it.
Inflation is very much like toothpaste out of the tube. It becomes a mess that cannot be controlled and leads to waste. Only the waste caused by excess inflation is much worse than a little excess toothpaste down the drain. In this financial crisis, however, we may have learned something that is a bit dangerous: that is that very low inflation leaves an economy less room for maneuver.
Under the leadership of former Fed Chairman Alan Greenspan all we heard was how price stability and zero inflation should be our goal and how the prices indices were biased up and so on. The lesson once again is, be careful what you wish for. Europe may fare better under lower inflation because of the breadth of its social welfare system. The US has had a harder, more stressful, time. But admitting that is not to say that US inflation should be higher or that the Fed should notch up its idea of its inflation target. It is simply to face the facts.
The ECB continues to be fixated on low inflation and, of course, has its inflation ceiling mandate. The Bank of England is similarly positioned but it has admitted to an inflation overshoot in the post crisis period that it says is not serious or lasting and contends it will ignore the temporary overshoot. The policy angle on inflation no one has really gotten their arms around is the impact of commodity prices - especially oil - on headline inflation. The ECB’s headline inflation ceiling put it in difficult straights when oil prices surged and drove headline inflation higher as the economy was weakening. The Fed’s focus on core inflation left it more flexibility to act.
Inflation is one of those peculiar things that we can all agree upon yet we find reasons to divert our attention and policy from the task at hand. It’s a bit like agreeing on what is a healthy diet yet periodically finding we are overweight and having to do something about it. The EU inflation situation appears to coming into a soft landing of sorts. That, of course, is aided and abetted by what looks like a poor growth result in the recovery. The US is in the same boat. So while the inflation situation seems in hand for now there will probably be no happily ever after here. Inflation fighting always involves pain, vigilance and sacrifice.
| Trends in EMU HICP; Flash Index | |||||||
|---|---|---|---|---|---|---|---|
| % Mo/Mo | SAAR | ||||||
| Feb-10 | Jan-10 | Dec-09 | 3-Mo | 6-Mo | 12-Mo | Yr Ago | |
| EMU-13 | 0.2% | -0.1% | 0.2% | 1.2% | 1.4% | 0.9% | 1.2% |
| Core | #N/A | -0.3% | 0.1% | -0.4% | 0.4% | 0.9% | 1.8% |
| Goods | #N/A | -0.9% | -0.1% | -2.4% | 1.4% | 0.7% | 0.2% |
| Services | #N/A | -0.5% | 0.8% | 0.3% | -0.7% | 1.4% | 2.4% |
| HICP | |||||||
| Germany | -0.3% | 0.1% | 0.1% | -0.4% | 0.2% | 0.3% | 1.0% |
| France | #N/A | 0.2% | 0.3% | 2.5% | 2.5% | 1.2% | 0.8% |
| Italy | 0.2% | -0.3% | 0.3% | 0.7% | 1.5% | 1.1% | 1.5% |
| UK | #N/A | 0.9% | 0.4% | #N/A | #N/A | #N/A | 3.1% |
| Spain | #N/A | 0.0% | 0.2% | 2.7% | 2.4% | 1.1% | 0.8% |
| Core:xFE&A | |||||||
| Germany | #N/A | -0.3% | 0.2% | -0.7% | 0.2% | 0.9% | 1.2% |
| France | #N/A | -0.2% | 0.2% | 0.1% | 0.3% | 0.9% | 1.6% |
| Italy | #N/A | -0.5% | 0.3% | 0.0% | 1.9% | 1.5% | 2.1% |
| UK | #N/A | 0.4% | 0.2% | 3.0% | 2.6% | 3.1% | 1.7% |
| Spain | #N/A | -0.3% | 0.1% | -0.1% | 0.0% | 0.3% | 1.9% |
| Blue shaded area data trail by one month | |||||||
by Louise Curley March 2,2010
 So
far
releases of January activity in Japan suggest continued good growth for
the economy as a whole in the first quarter. Last week,
foreign trade and industrial production reports were positive and
today's employment and workers' household spending data are further
evidence of increased good news for Japan.
So
far
releases of January activity in Japan suggest continued good growth for
the economy as a whole in the first quarter. Last week,
foreign trade and industrial production reports were positive and
today's employment and workers' household spending data are further
evidence of increased good news for Japan.
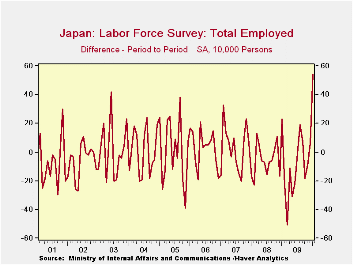
The unemployment rate in Japan fell to 4.9% from 5.2% in December largely as a result of an almost unprecedented increase of 540 million jobs. One has to go back to October 1973, to find a higher monthly increase in jobs. The changed in the number of employed persons represents the changes in jobs and is shown in the first chart. The rise in Active Openings/Applications, though small, is encouraging as this measure is thought to be a good indication of future employment. (Active Openings/Applications, JAOR@JAPAN, is found in Employment Referral Statistics in Haver's Japan data base.)
Japan's 4.9% unemployment rate compares
with 9.7% in the United States and 9.9% in the Euro Area.
Japan's 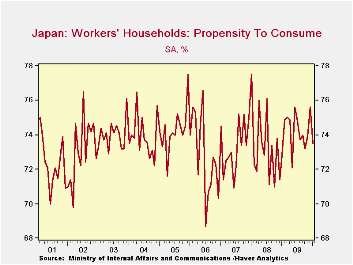 tradition of lifetime employment has tended to keep its
unemployment rate low relative to American and European standards, but
the lifetime employment commitment is beginning to erode and many
Japanese firms find they are overstaffed. As a result further
dramatic increases in jobs may be limited.
tradition of lifetime employment has tended to keep its
unemployment rate low relative to American and European standards, but
the lifetime employment commitment is beginning to erode and many
Japanese firms find they are overstaffed. As a result further
dramatic increases in jobs may be limited.
Disposable income in Workers' Households increased 3.4% in January from December. Although the increase in living expenditures was only 0.42%, it was larger than the 0.31% increase in December. But with the larger increase in income than in expenditures, the propensity to consume of these households declined 2.1 percentage points from 75.6% in December to 73.5% in January. The propensity to consume has shown considerable volatility, but within a fairly narrow range from 68.7% to 77.5% since January 2000 when the data first became available. The propensity to consume since 2001 is shown in the second chart.
| JAPAN | Jan 10 | Dec 09 | Jan 09 | M/M Chg | Y/Y Chg | 2009 | 2008 | 2007 |
|---|---|---|---|---|---|---|---|---|
| Employed Persons (1000) | 63030 | 62490 | 63830 | 540 | -800 | 62820 | 63850 | 64120 |
| Unemployed Persons (1000) | 3280 | 3440 | 2810 | -160 | 470 | 3360 | 2650 | 2570 |
| Unemployment Rate (%) | 4.9 | 5.2 | 4.2 | -0.3 | 0.7 | 5.1 | 4.0 | 3.8 |
| Active Openings/Applications (ratio) | 0.46 | 0.43 | 0.65 | 0.3 | -0.19 | 0.48 | 0.88 | 1.04 |
| Workers' Households | ||||||||
| Disposable Income (2005=100) | 97.3 | 94.1 | 99.1 | 3.40% | -1.82% | 97.0 | 99.9 | 99.8 |
| Living Expenditures (2005=100 | 96.3 | 95.9 | 97.2 | 0.42% | -0.93% | 96.9 | 98.7 | 98.5 |
| Propensity to Consume (%) | 73.5 | 75.6 | 72.8 | -2.1 | 0.7 | 74.2 | 73.4 | 73.3 |

Tom Moeller
AuthorMore in Author Profile »Prior to joining Haver Analytics in 2000, Mr. Moeller worked as the Economist at Chancellor Capital Management from 1985 to 1999. There, he developed comprehensive economic forecasts and interpreted economic data for equity and fixed income portfolio managers. Also at Chancellor, Mr. Moeller worked as an equity analyst and was responsible for researching and rating companies in the economically sensitive automobile and housing industries for investment in Chancellor’s equity portfolio. Prior to joining Chancellor, Mr. Moeller was an Economist at Citibank from 1979 to 1984. He also analyzed pricing behavior in the metals industry for the Council on Wage and Price Stability in Washington, D.C. In 1999, Mr. Moeller received the award for most accurate forecast from the Forecasters' Club of New York. From 1990 to 1992 he was President of the New York Association for Business Economists. Mr. Moeller earned an M.B.A. in Finance from Fordham University, where he graduated in 1987. He holds a Bachelor of Arts in Economics from George Washington University.
More Economy in Brief


