 Global| Sep 21 2010
U.S. Housing Starts Rise Unexpectedly Due To Multi-Family Jump
by:Tom Moeller
|in:Economy in Brief
Summary
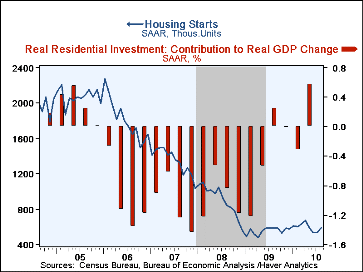
Housing starts improved last month to the highest level since April; just before the expiration of the government's home buyer tax credit. August housing starts improved 10.5% m/m to 598,000 (AR) after a 0.4% July uptick which was [...]
Housing starts improved last month to the highest level since April; just before the expiration of the government's home buyer tax credit. August housing starts improved 10.5% m/m to 598,000 (AR) after a 0.4% July uptick which was slightly less than reported initially. The improvement pulled starts 25.4% above the low of the last recession and the August level was higher than Consensus expectations for 550,000 starts.
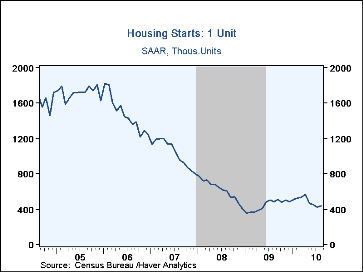
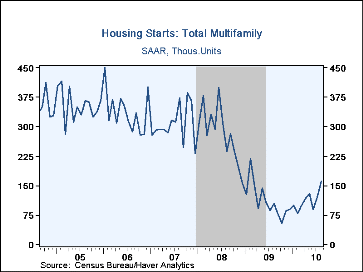
Last month's gain was due largely to a near one-third rise in starts of multi-family units. Starts of apartments, condominiums & town houses jumped to 160,000 units and were one-half above the year-ago level. Starts of single-family homes rose a lesser 4.3% to 438,000 and that did not make up the July decline. A roughly one-third gain in starts in the West led last month's increase. However, here too, single-family starts just made up the July decline and remained down 18.6% y/y. In the Midwest starts rose 18.9% (2.3% y/y) and in the South they rose 7.0% (2.8% y/y) which also was largely due to a rebound in multi-family. In the Northeast, starts fell 24.3% due to a greater decline in single-family.
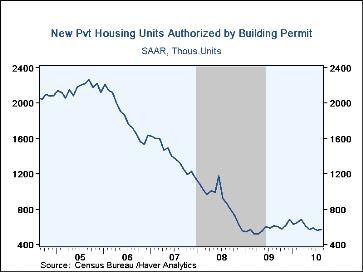
Another glimmer of good news in the report was that building permits in August rose 1.8% but the gain was all due to a 9.8% increase (31.3% y/y) in multi-family. Single-family permits fell 1.2% (-16.8% y/y) for the fifth consecutive month of decline.
The housing starts figures can be found in Haver's USECON database.
| Housing Starts (000s, SAAR) | August | July | June | August Y/Y | 2009 | 2008 | 2007 |
|---|---|---|---|---|---|---|---|
| Total | 598 | 541 | 539 | 2.2% | 554 | 900 | 1,342 |
| Single-Family | 438 | 420 | 450 | -9.1 | 442 | 616 | 1,036 |
| Multi-Family | 160 | 121 | 89 | 55.3 | 112 | 284 | 306 |
| Starts By Region | |||||||
| Northeast | 56 | 74 | 60 | -21.1 | 61 | 120 | 143 |
| Midwest | 112 | 92 | 83 | 5.7 | 95 | 134 | 206 |
| South | 289 | 270 | 287 | 2.8 | 281 | 451 | 676 |
| West | 141 | 105 | 109 | 11. | 117 | 195 | 317 |
| Building Permits | 569 | 559 | 583 | -6.7 | 583 | 896 | 1,392 |
Tom Moeller
AuthorMore in Author Profile »Prior to joining Haver Analytics in 2000, Mr. Moeller worked as the Economist at Chancellor Capital Management from 1985 to 1999. There, he developed comprehensive economic forecasts and interpreted economic data for equity and fixed income portfolio managers. Also at Chancellor, Mr. Moeller worked as an equity analyst and was responsible for researching and rating companies in the economically sensitive automobile and housing industries for investment in Chancellor’s equity portfolio. Prior to joining Chancellor, Mr. Moeller was an Economist at Citibank from 1979 to 1984. He also analyzed pricing behavior in the metals industry for the Council on Wage and Price Stability in Washington, D.C. In 1999, Mr. Moeller received the award for most accurate forecast from the Forecasters' Club of New York. From 1990 to 1992 he was President of the New York Association for Business Economists. Mr. Moeller earned an M.B.A. in Finance from Fordham University, where he graduated in 1987. He holds a Bachelor of Arts in Economics from George Washington University.


